Plots historical data with multivariate forecasts and prediction intervals.
Arguments
- object
Multivariate forecast object of class
mforecast. Used for ggplot graphics (S3 method consistency).- PI
If
FALSE, confidence intervals will not be plotted, giving only the forecast line.- facets
If
TRUE, multiple time series will be faceted. IfFALSE, each series will be assigned a colour.- colour
If
TRUE, the time series will be assigned a colour aesthetic- ...
additional arguments to each individual
plot.- series
Matches an unidentified forecast layer with a coloured object on the plot.
- x
Multivariate forecast object of class
mforecast.- main
Main title. Default is the forecast method. For autoplot, specify a vector of titles for each plot.
- xlab
X-axis label. For autoplot, specify a vector of labels for each plot.
References
Hyndman and Athanasopoulos (2018) Forecasting: principles and practice, 2nd edition, OTexts: Melbourne, Australia. https://otexts.com/fpp2/
Examples
library(ggplot2)
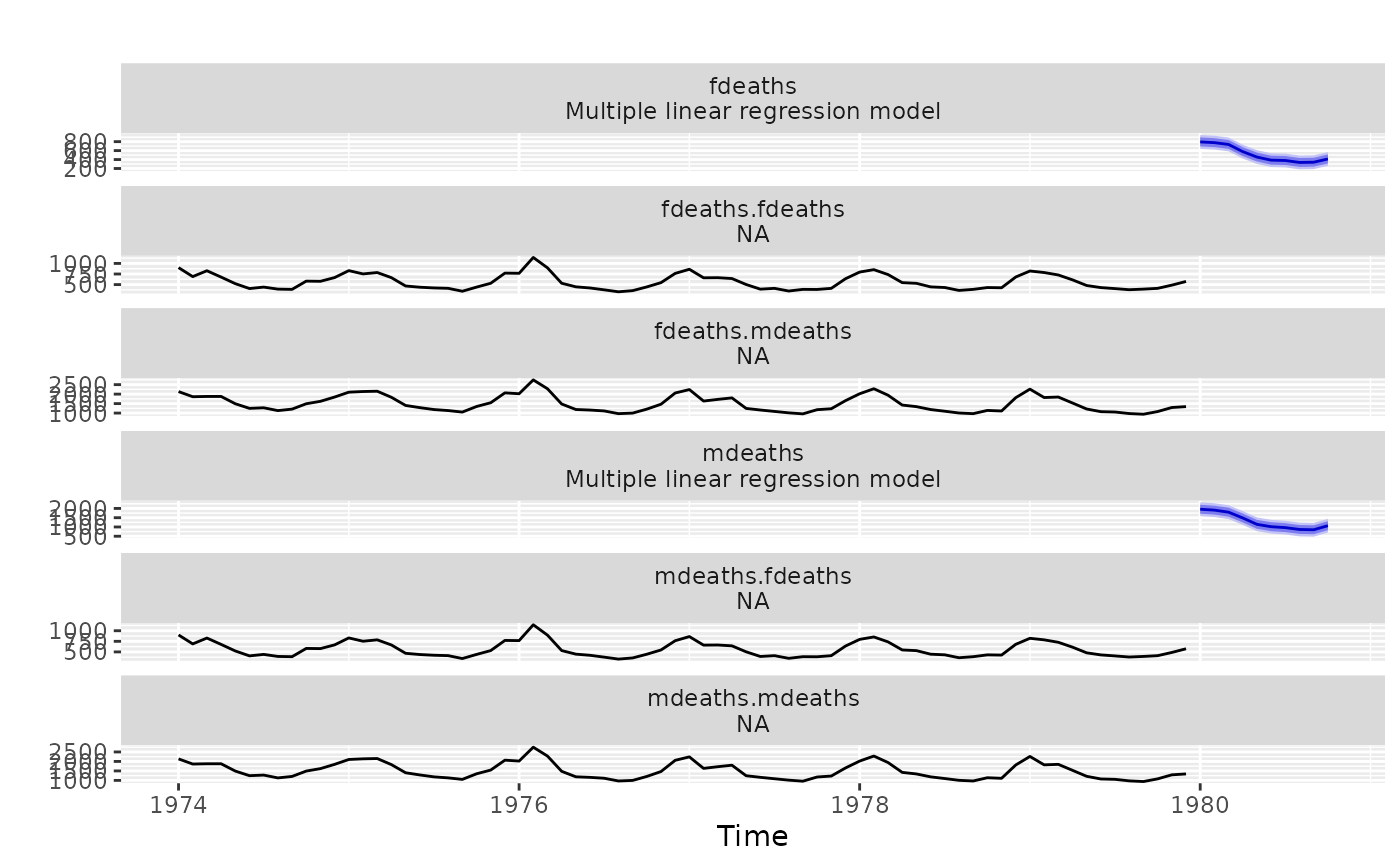
lungDeaths <- cbind(mdeaths, fdeaths)
fit <- tslm(lungDeaths ~ trend + season)
fcast <- forecast(fit, h = 10)
plot(fcast)
 autoplot(fcast)
 carPower <- as.matrix(mtcars[, c("qsec", "hp")])
carmpg <- mtcars[, "mpg"]
fit <- lm(carPower ~ carmpg)
fcast <- forecast(fit, newdata = data.frame(carmpg = 30))
plot(fcast, xlab = "Year")
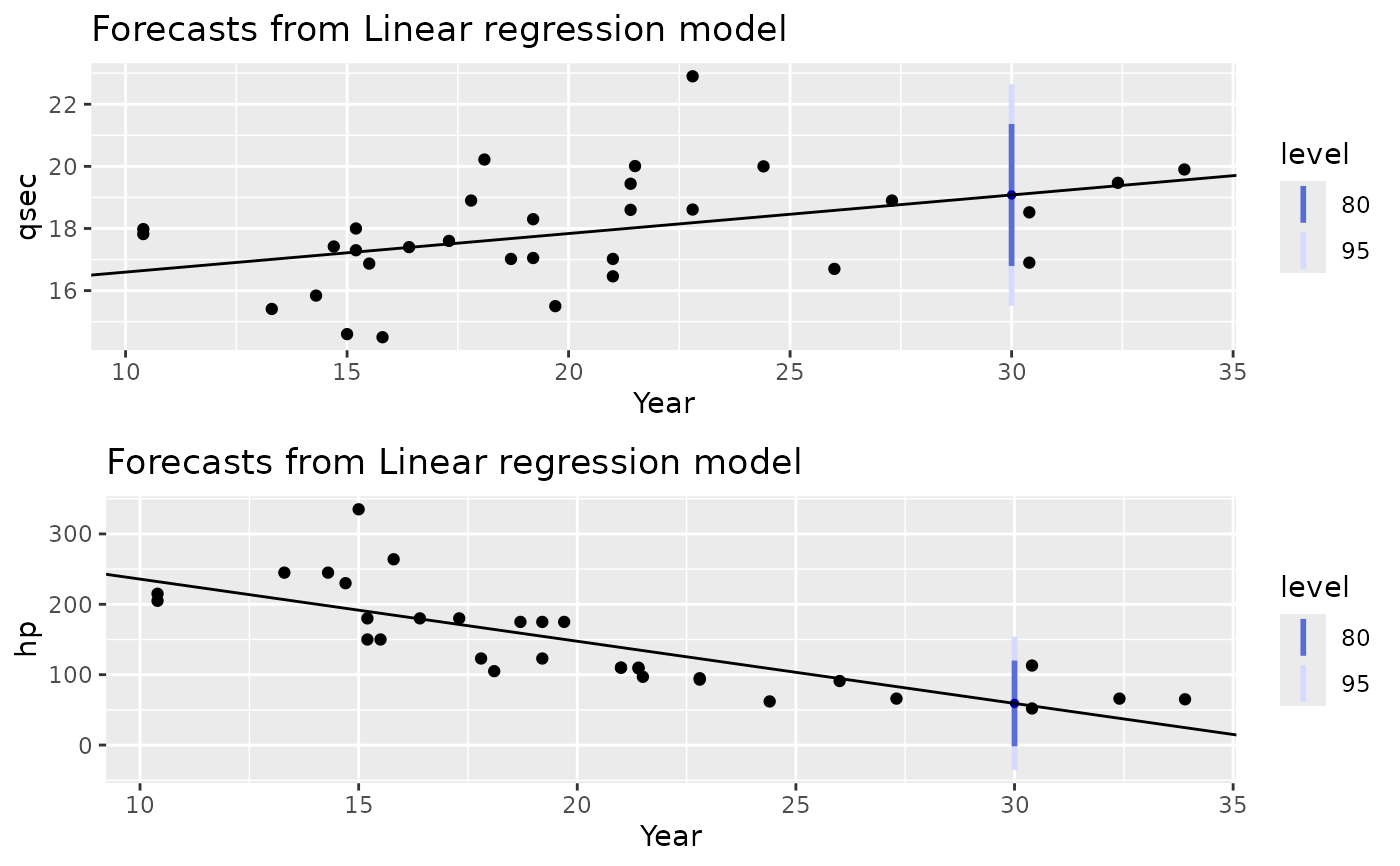
carPower <- as.matrix(mtcars[, c("qsec", "hp")])
carmpg <- mtcars[, "mpg"]
fit <- lm(carPower ~ carmpg)
fcast <- forecast(fit, newdata = data.frame(carmpg = 30))
plot(fcast, xlab = "Year")
 autoplot(fcast, xlab = rep("Year", 2))