fourier returns a matrix containing terms from a Fourier series, up to
order K, suitable for use in Arima(), auto.arima(), or tslm().
Details
fourierf is deprecated, instead use the h argument in fourier.
The period of the Fourier terms is determined from the time series
characteristics of x. When h is missing, the length of
x also determines the number of rows for the matrix returned by
fourier. Otherwise, the value of h determines the number of
rows for the matrix returned by fourier, typically used for
forecasting. The values within x are not used.
Typical use would omit h when generating Fourier terms for training a model
and include h when generating Fourier terms for forecasting.
When x is a ts object, the value of K should be an
integer and specifies the number of sine and cosine terms to return. Thus,
the matrix returned has 2*K columns.
When x is a msts object, then K should be a vector of
integers specifying the number of sine and cosine terms for each of the
seasonal periods. Then the matrix returned will have 2*sum(K)
columns.
Examples
library(ggplot2)
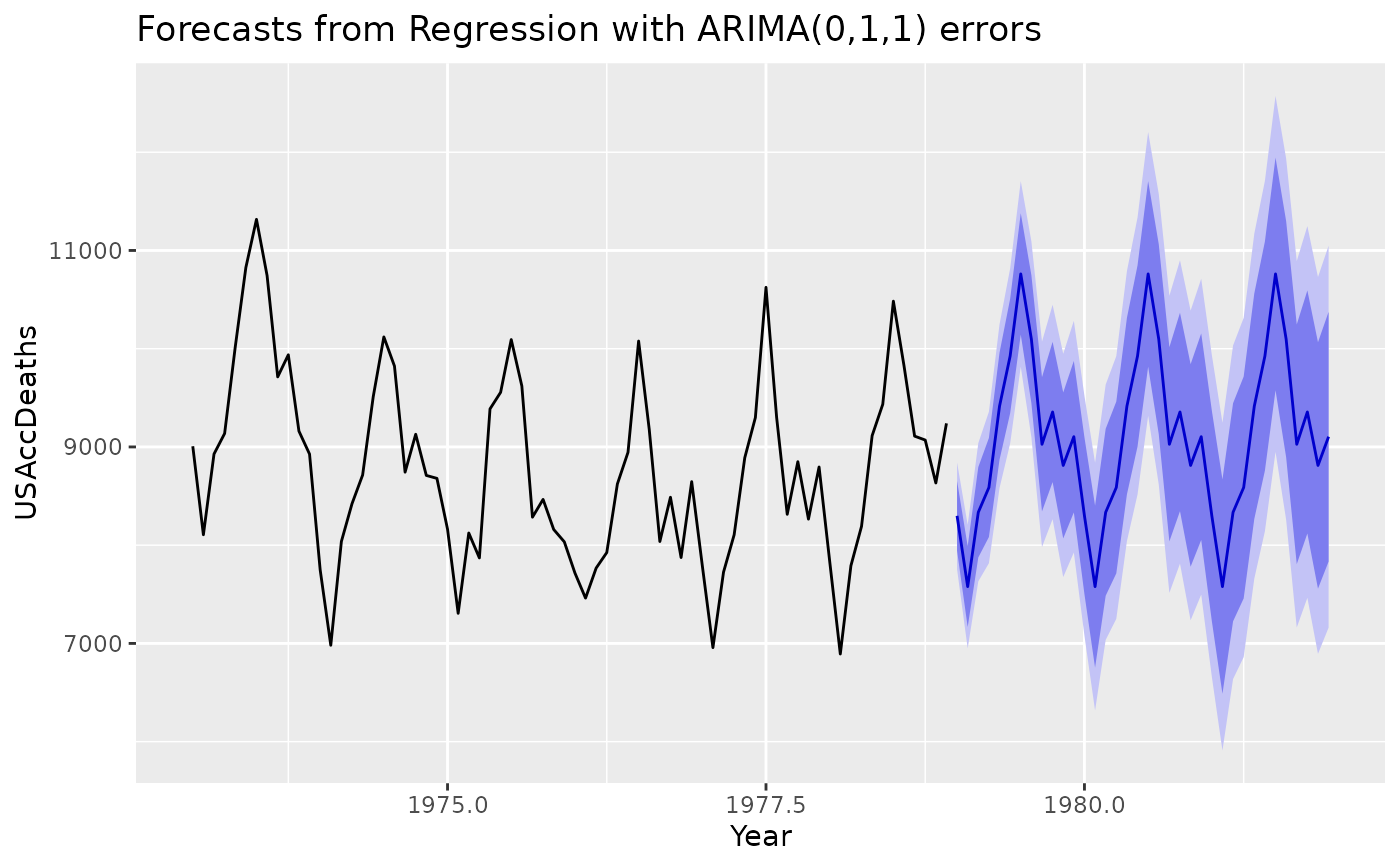
# Using Fourier series for a "ts" object
# K is chosen to minimize the AICc
deaths.model <- auto.arima(
USAccDeaths,
xreg = fourier(USAccDeaths, K = 5),
seasonal = FALSE
)
deaths.fcast <- forecast(
deaths.model,
xreg = fourier(USAccDeaths, K = 5, h = 36)
)
autoplot(deaths.fcast) + xlab("Year")
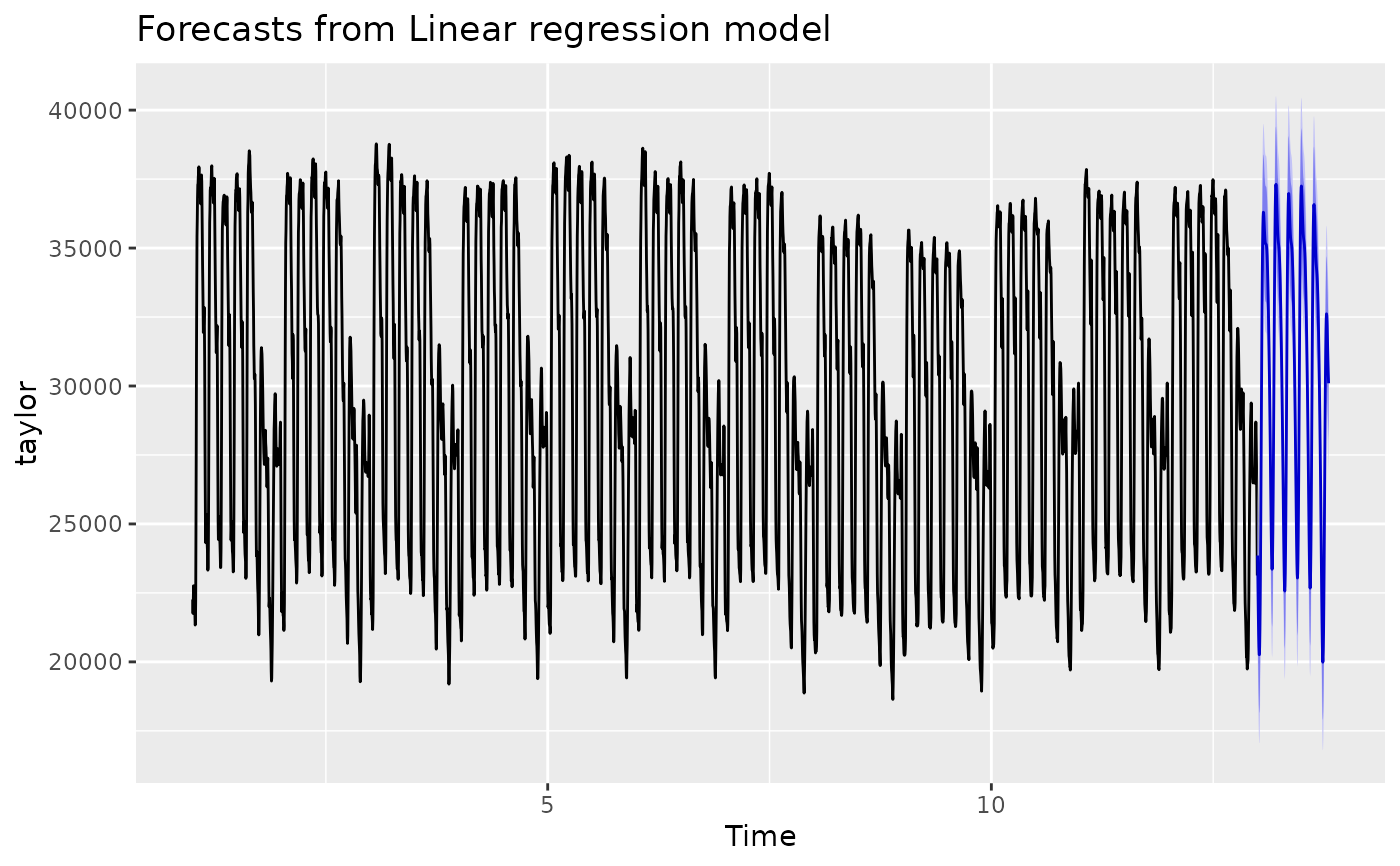
 # Using Fourier series for a "msts" object
taylor.lm <- tslm(taylor ~ fourier(taylor, K = c(3, 3)))
taylor.fcast <- forecast(
taylor.lm,
data.frame(fourier(taylor, K = c(3, 3), h = 270))
)
autoplot(taylor.fcast)
# Using Fourier series for a "msts" object
taylor.lm <- tslm(taylor ~ fourier(taylor, K = c(3, 3)))
taylor.fcast <- forecast(
taylor.lm,
data.frame(fourier(taylor, K = c(3, 3), h = 270))
)
autoplot(taylor.fcast)