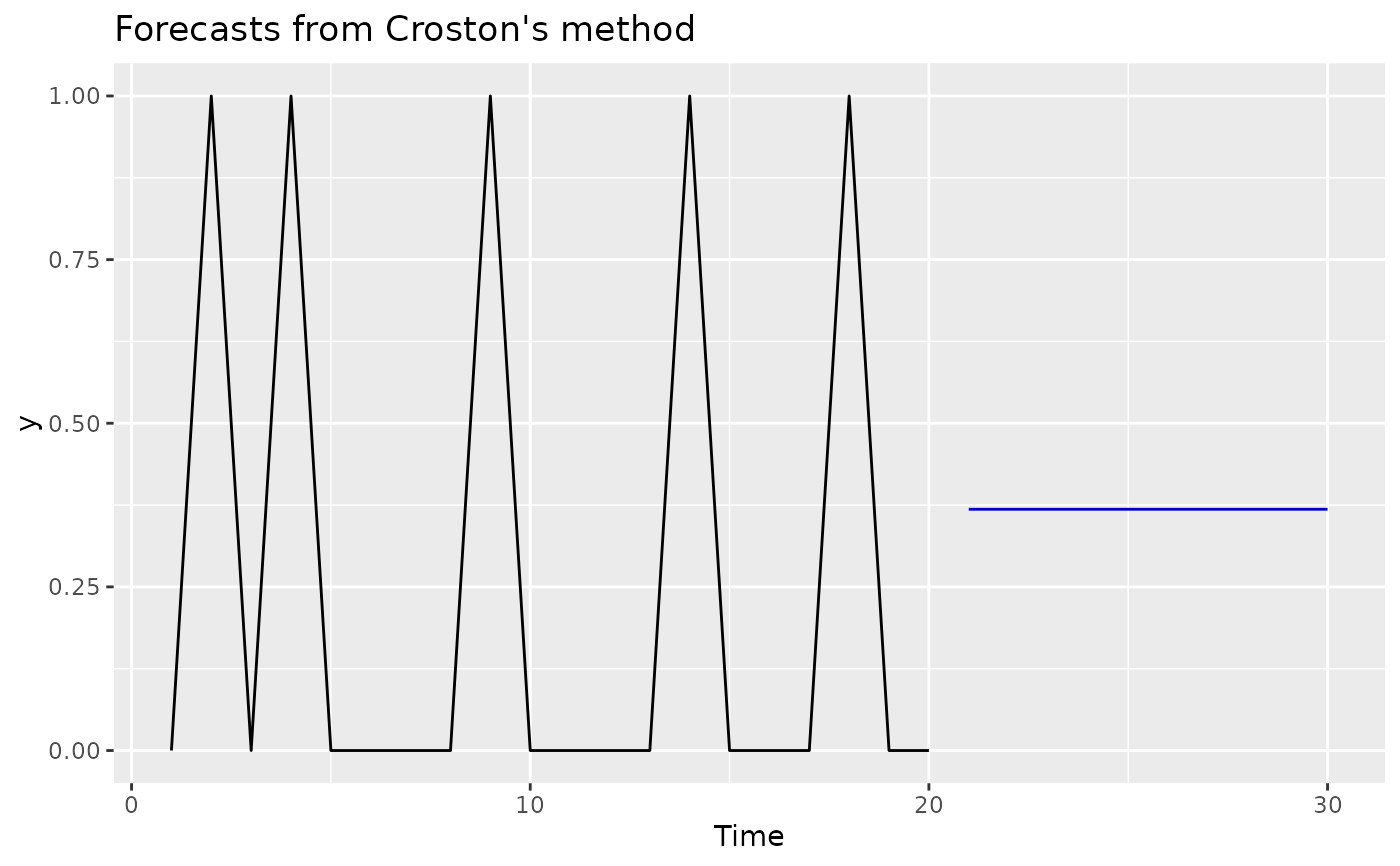
Forecasts for intermittent demand using Croston's method
Source:R/croston.R
forecast.croston_model.RdReturns forecasts and other information for Croston's forecasts applied to y.
Arguments
- object
An object of class
croston_modelas returned bycroston_model().- h
Number of periods for forecasting. Default value is twice the largest seasonal period (for seasonal data) or ten (for non-seasonal data).
- ...
Additional arguments affecting the forecasts produced. If
model = NULL,forecast.tspasses these toets()orstlf()depending on the frequency of the time series. Ifmodelis notNULL, the arguments are passed to the relevant modelling function.- y
a numeric vector or univariate time series of class
ts- alpha
Value of alpha. Default value is 0.1.
- type
Which variant of Croston's method to use. Defaults to
"croston"for Croston's method, but can also be set to"sba"for the Syntetos-Boylan approximation, and"sbj"for the Shale-Boylan-Johnston method.- x
Deprecated. Included for backwards compatibility.
Details
Based on Croston's (1972) method for intermittent demand forecasting, also
described in Shenstone and Hyndman (2005). Croston's method involves using
simple exponential smoothing (SES) on the non-zero elements of the time
series and a separate application of SES to the times between non-zero
elements of the time series. The smoothing parameters of the two
applications of SES are assumed to be equal and are denoted by alpha.
Note that prediction intervals are not computed as Croston's method has no underlying stochastic model.
forecast class
An object of class forecast is a list usually containing at least
the following elements:
- model
A list containing information about the fitted model
- method
The name of the forecasting method as a character string
- mean
Point forecasts as a time series
- lower
Lower limits for prediction intervals
- upper
Upper limits for prediction intervals
- level
The confidence values associated with the prediction intervals
- x
The original time series.
- residuals
Residuals from the fitted model. For models with additive errors, the residuals will be x minus the fitted values.
- fitted
Fitted values (one-step forecasts)
The function summary can be used to obtain and print a summary of the
results, while the functions plot and autoplot produce plots of the forecasts and
prediction intervals. The generic accessor functions fitted.values and residuals
extract various useful features from the underlying model.
References
Croston, J. (1972) "Forecasting and stock control for intermittent demands", Operational Research Quarterly, 23(3), 289-303.
Shale, E.A., Boylan, J.E., & Johnston, F.R. (2006). Forecasting for intermittent demand: the estimation of an unbiased average. Journal of the Operational Research Society, 57(5), 588-592.
Shenstone, L., and Hyndman, R.J. (2005) "Stochastic models underlying Croston's method for intermittent demand forecasting". Journal of Forecasting, 24, 389-402.
Syntetos A.A., Boylan J.E. (2001). On the bias of intermittent demand estimates. International Journal of Production Economics, 71, 457–466.