Check that residuals from a time series model look like white noise
Source:R/checkresiduals.R
checkresiduals.RdIf plot = TRUE, produces a time plot of the residuals, the
corresponding ACF, and a histogram. If test is not FALSE,
the output from either a Ljung-Box test or Breusch-Godfrey test is printed.
Arguments
- object
Either a time series model, a forecast object, or a time series (assumed to be residuals).
- lag
Number of lags to use in the Ljung-Box or Breusch-Godfrey test. If missing, it is set to
min(10, n/5)for non-seasonal data, andmin(2m, n/5)for seasonal data, wherenis the length of the series, andmis the seasonal period of the data. It is further constrained to be at leastdf+3wheredfis the degrees of freedom of the model. This ensures there are at least 3 degrees of freedom used in the chi-squared test.- test
Test to use for serial correlation. By default, if
objectis of classlm, thentest = "BG". Otherwise,test = "LB". Settingtest = FALSEwill prevent the test results being printed.- plot
Logical. If
TRUE, will produce the plot.- ...
Other arguments are passed to
ggtsdisplay().
Examples
fit <- ets(WWWusage)
checkresiduals(fit)
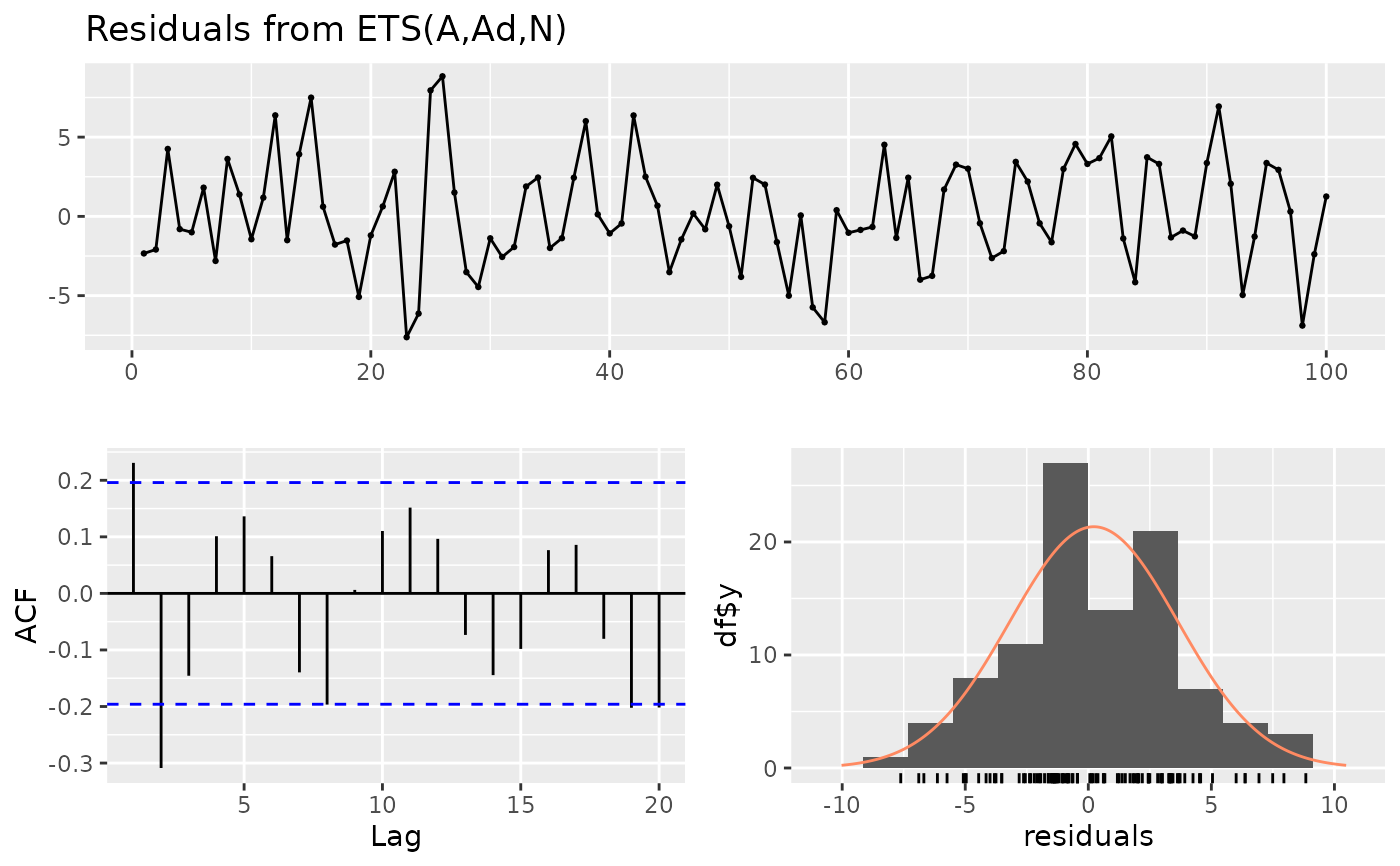 #>
#> Ljung-Box test
#>
#> data: Residuals from ETS(A,Ad,N)
#> Q* = 28.995, df = 10, p-value = 0.001249
#>
#> Model df: 0. Total lags used: 10
#>
#>
#> Ljung-Box test
#>
#> data: Residuals from ETS(A,Ad,N)
#> Q* = 28.995, df = 10, p-value = 0.001249
#>
#> Model df: 0. Total lags used: 10
#>