Type of plot depends on value of plot.type:
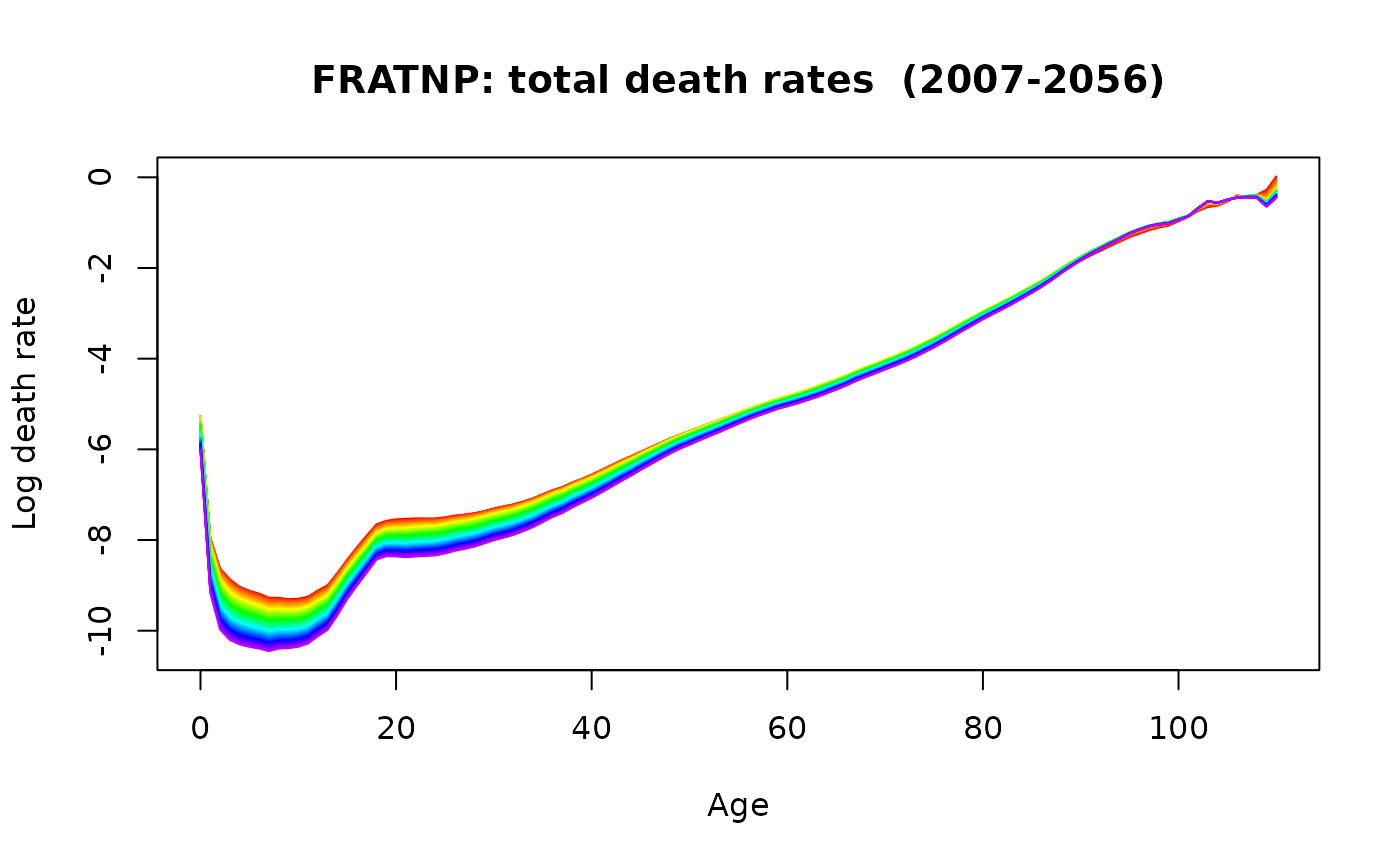
plot.type="function"produces a plot of the forecast functions;
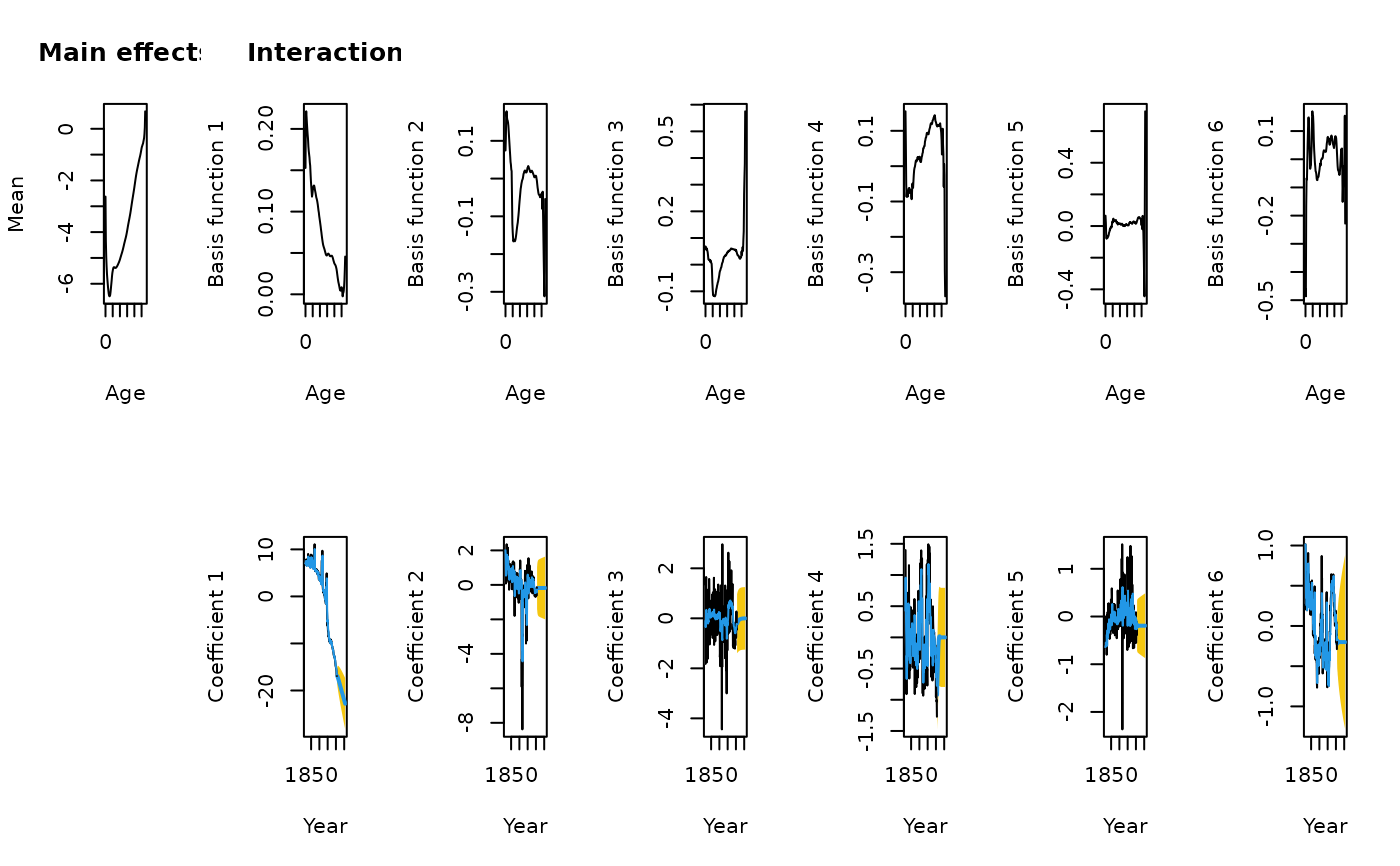
plot.type="components"produces a plot of the basis functions and coefficients with forecasts and prediction intervals for each coefficient;
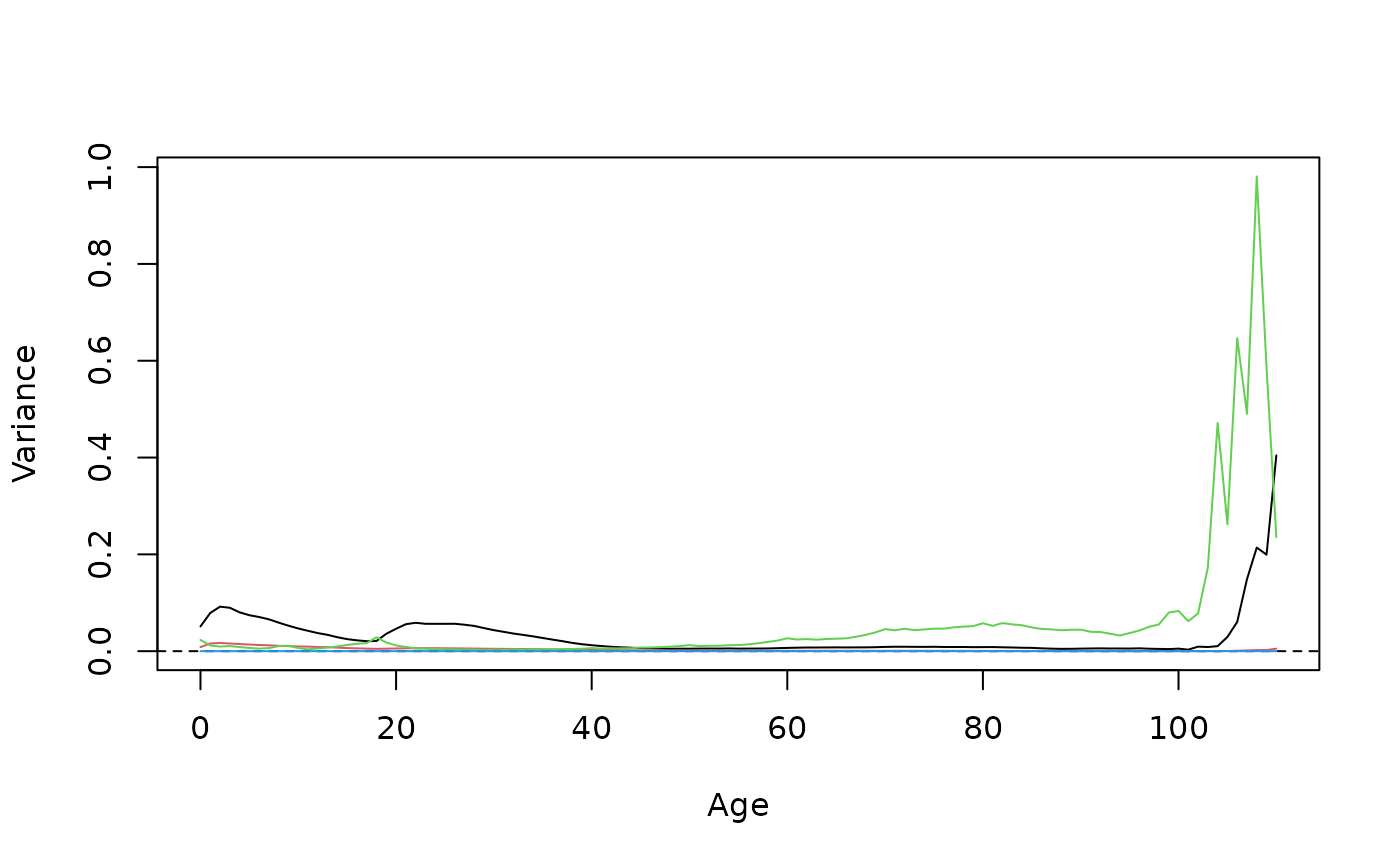
plot.type="variance"produces a plot of the variance components.
Arguments
- x
Output from
forecast.ftsm,forecast.fdmorlca.- plot.type
Type of plot. See details.
- vcol
Colors to use if
plot.type="variance".- mean.lab
Label for mean component.
- xlab2
x-axis label for coefficient time series.
- h
If
plot.type="variance", h gives the forecast horizon for which the variance is plotted.- ...
Other arguments are passed to
plot.demogdata(ifplot.type=="function"),plot(ifplot.type=="variance") orplot.ftsf(ifplot.type=="component").