Skip to contents

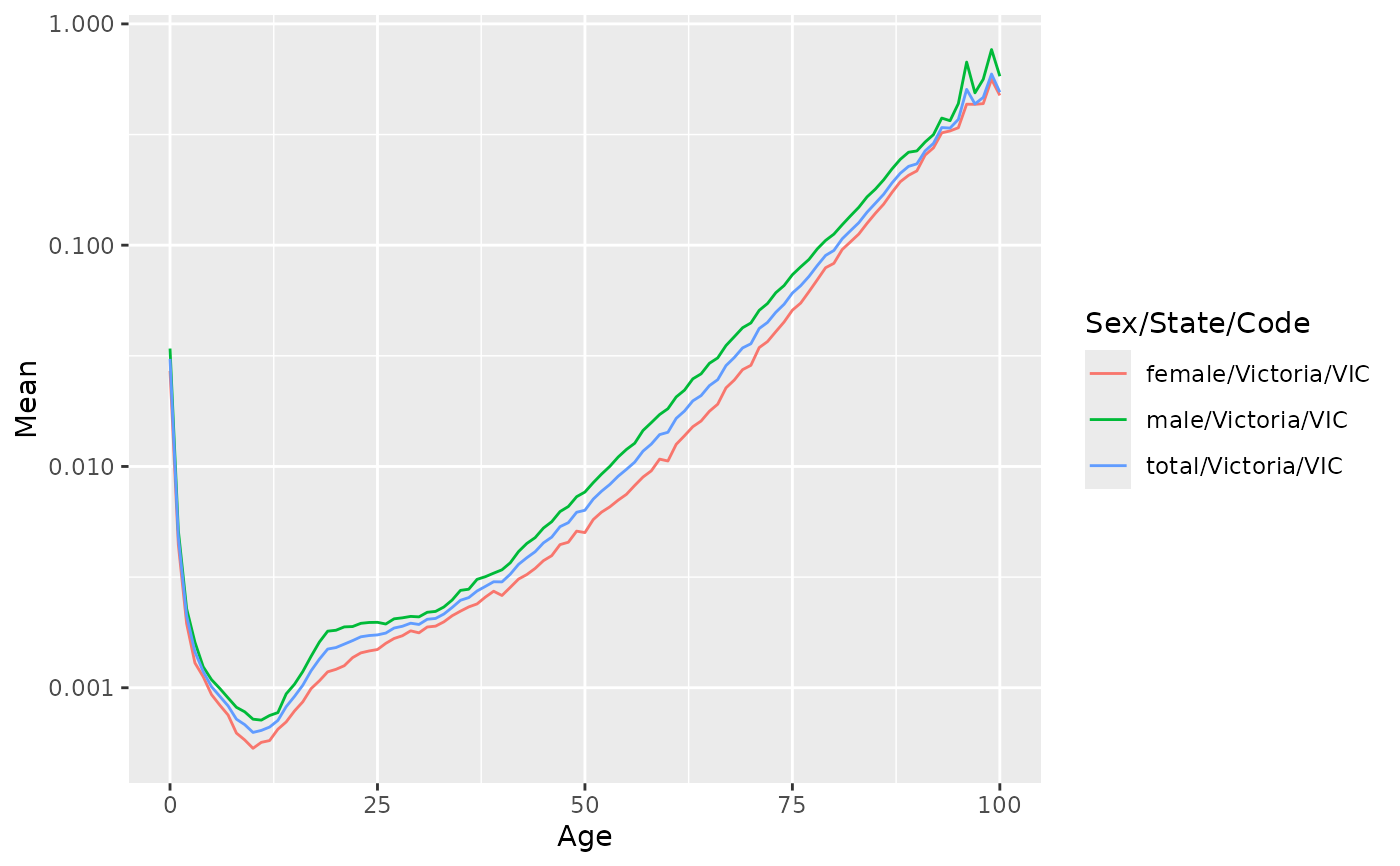
Produces a plot showing a model applied to a vital object. This can be applied to one type of model only. So use select() to choose the model column to plot. If there are multiple keys, separate models will be identified by colour.

Usage

# S3 method for class 'mdl_vtl_df'
autoplot(object, ...)

Arguments

object

A mable object obtained from a vital.

...

Further arguments ignored.

Value

A ggplot2 object.

Author

Rob J Hyndman

Examples

library(ggplot2)
aus_mortality |>
 dplyr::filter(State == "Victoria") |>
 model(ave = FMEAN(Mortality)) |>
 autoplot() + scale_y_log10()