Loading [MathJax]/jax/output/HTML-CSS/jax.js
Skip to contents

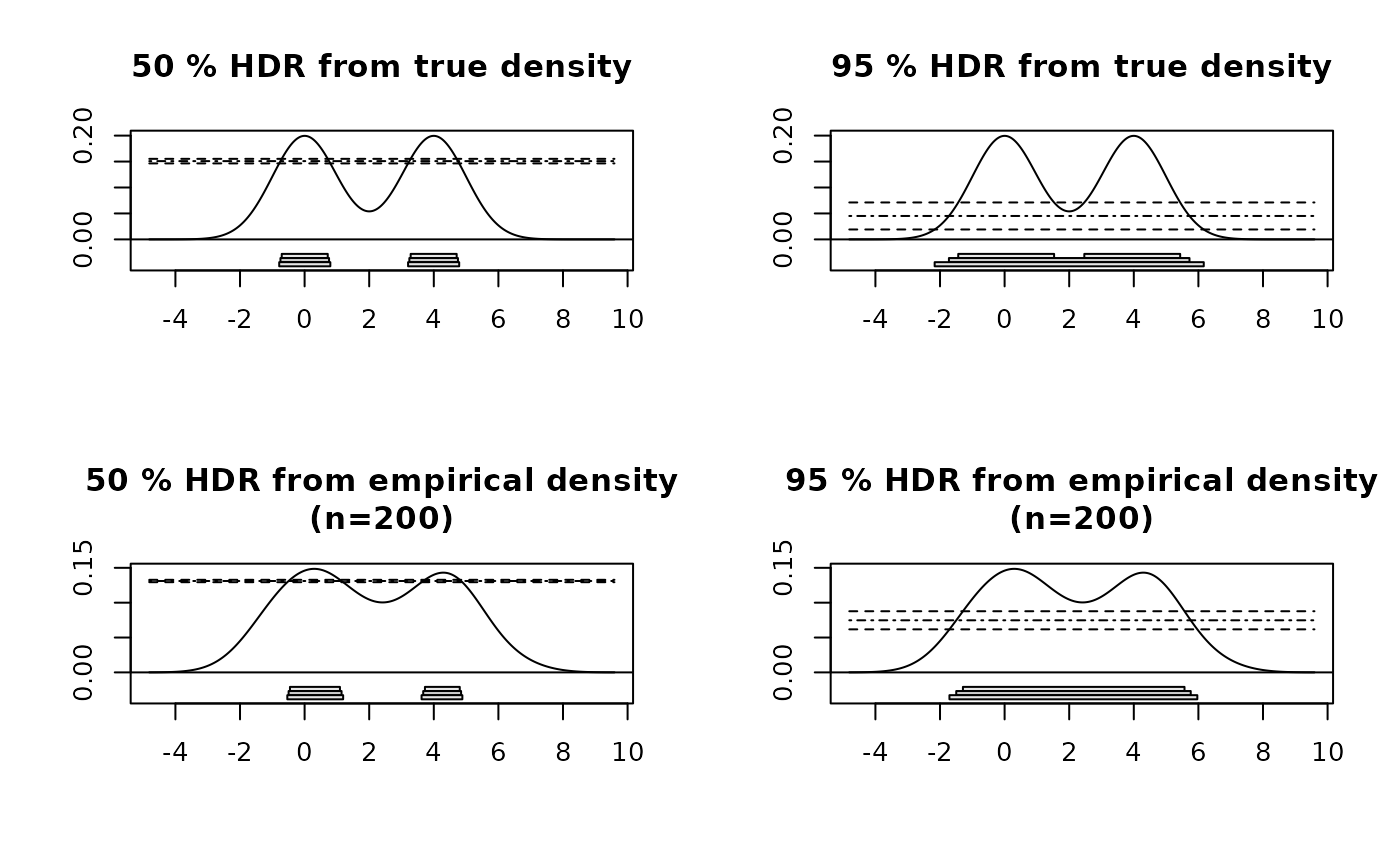
Calculates Highest Density Regions with confidence intervals.

Usage

hdrconf(x, den, prob = 95, conf = 95)

Arguments

x

Numeric vector containing data.

den

Density of data as list with components x and y.

prob

Probability coverage for for HDRs.

conf

Confidence for limits on HDR.

Value

hdrconf returns list containing the following components:

hdr

Highest density regions

hdr.lo

Highest density regions corresponding to lower confidence limit.

hdr.hi

Highest density regions corresponding to upper confidence limit.

falpha

Values of fα corresponding to HDRs.

falpha.ci

Values of fα corresponding to lower and upper limits.

References

Hyndman, R.J. (1996) Computing and graphing highest density regions American Statistician, 50, 120-126.

See also

Author

Rob J Hyndman

Examples

x <- c(rnorm(100,0,1),rnorm(100,4,1))
den <- density(x,bw=hdrbw(x,50))
trueden <- den
trueden$y <- 0.5*(exp(-0.5*(den$x*den$x)) + exp(-0.5*(den$x-4)^2))/sqrt(2*pi)
sortx <- sort(x)

par(mfcol=c(2,2))
for(conf in c(50,95))
{
  m <- hdrconf(sortx,trueden,conf=conf)
  plot(m,trueden,main=paste(conf,"% HDR from true density"))
  m <- hdrconf(sortx,den,conf=conf)
  plot(m,den,main=paste(conf,"% HDR from empirical density\n(n=200)"))
}