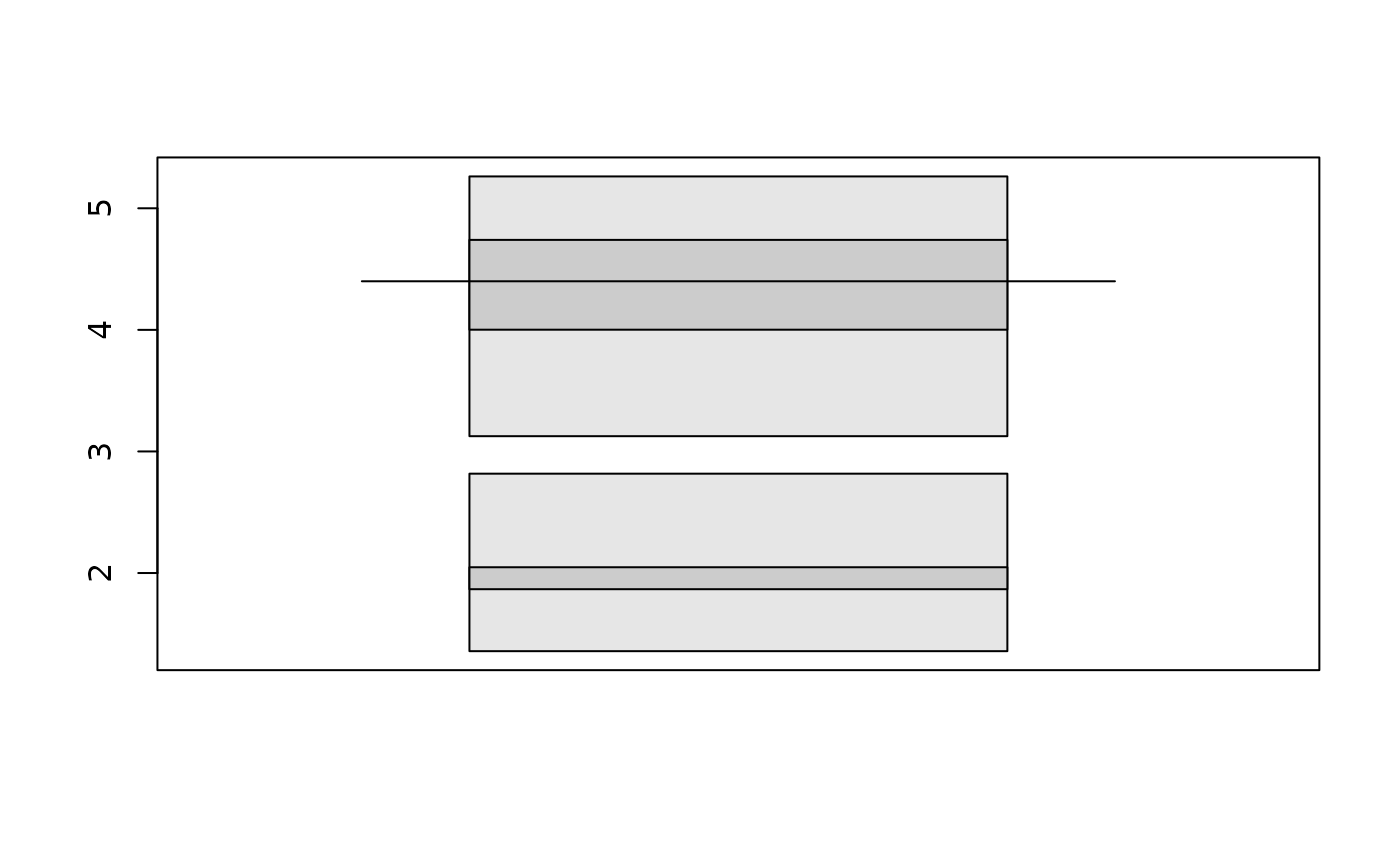
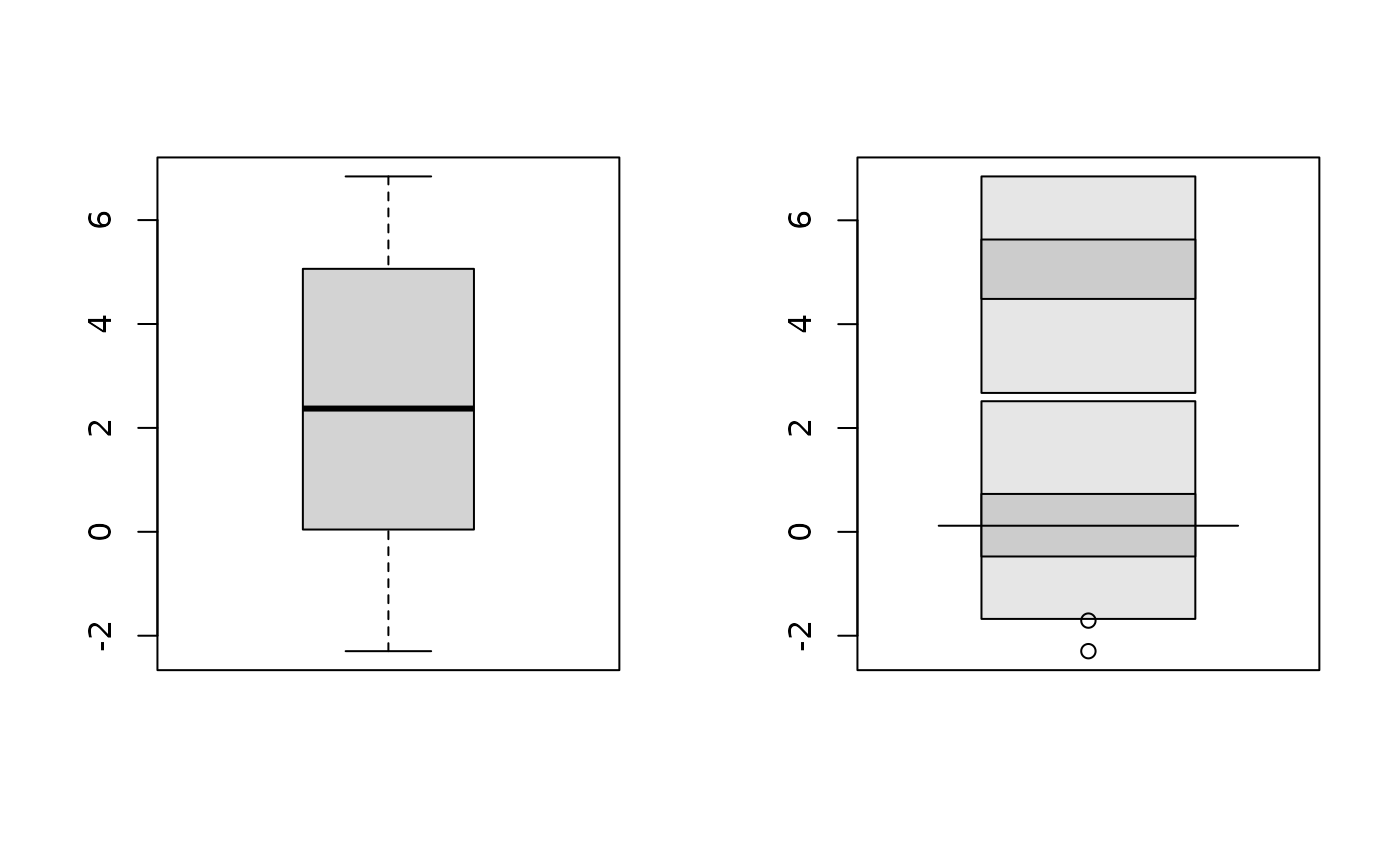
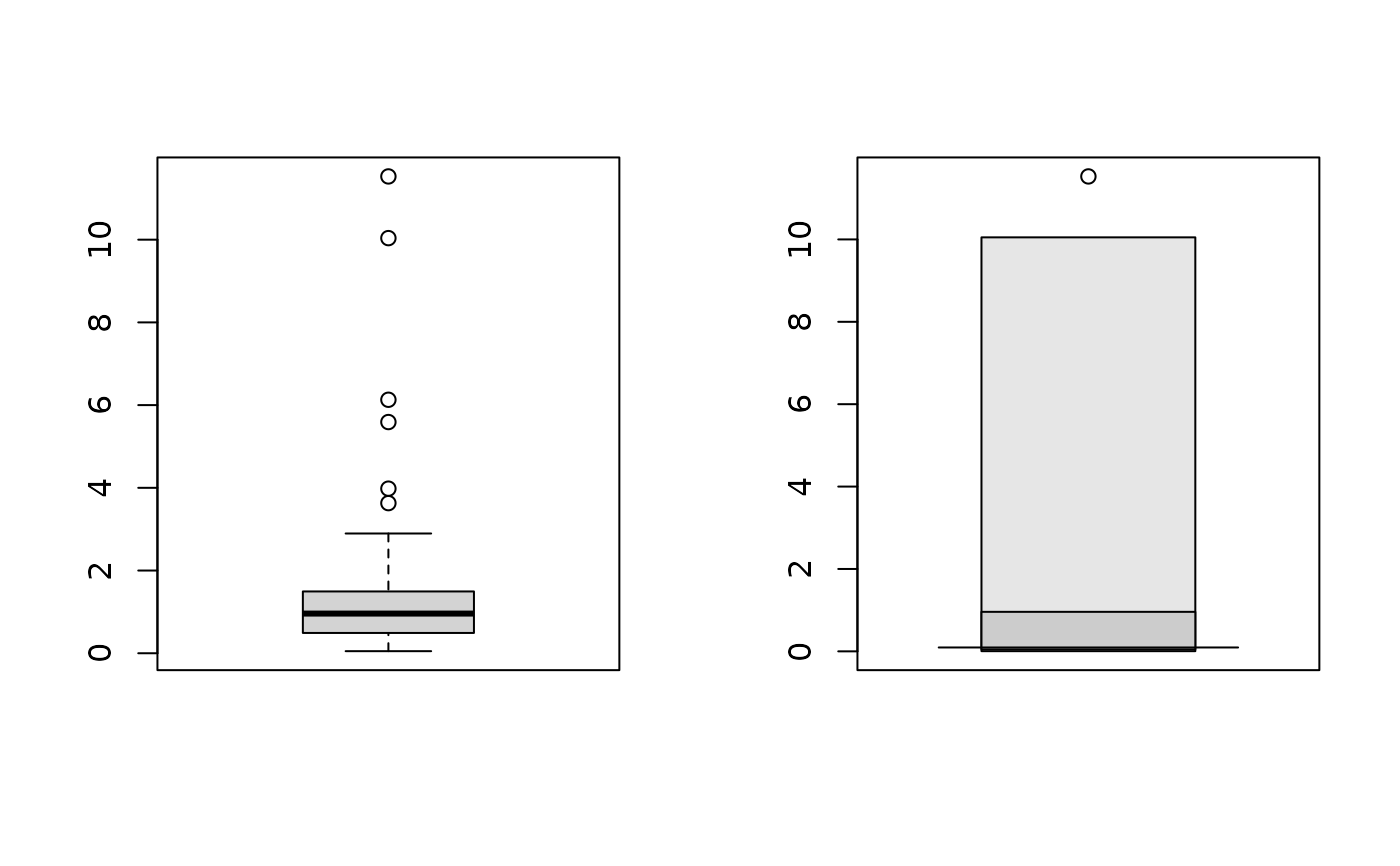
Calculates and plots a univariate highest density regions boxplot.
Arguments
- x
Numeric vector containing data or a list containing several vectors.
- prob
Probability coverage required for HDRs
stats::density().- h
Optional bandwidth for calculation of density.
- lambda
Box-Cox transformation parameter where \(0 \le \lambda \le 1\).
- boxlabels
Label for each box plotted.
- col
Colours for regions of each box.
- main
Overall title for the plot.
- xlab
Label for x-axis.
- ylab
Label for y-axis.
- pch
Plotting character.
- border
Width of border of box.
- outline
If not
TRUE, the outliers are not drawn.- space
The space between each box, between 0 and 0.5.
- ...
Other arguments passed to plot.
Details
The density is estimated using kernel density estimation. A Box-Cox
transformation is used if lambda!=1, as described in Wand, Marron and
Ruppert (1991). This allows the density estimate to be non-zero only on the
positive real line. The default kernel bandwidth h is selected using
the algorithm of Samworth and Wand (2010).
Hyndman's (1996) density quantile algorithm is used for calculation.
References
Hyndman, R.J. (1996) Computing and graphing highest density regions. American Statistician, 50, 120-126.
Samworth, R.J. and Wand, M.P. (2010). Asymptotics and optimal bandwidth selection for highest density region estimation. The Annals of Statistics, 38, 1767-1792.
Wand, M.P., Marron, J S., Ruppert, D. (1991) Transformations in density estimation. Journal of the American Statistical Association, 86, 343-353.