Skip to contents

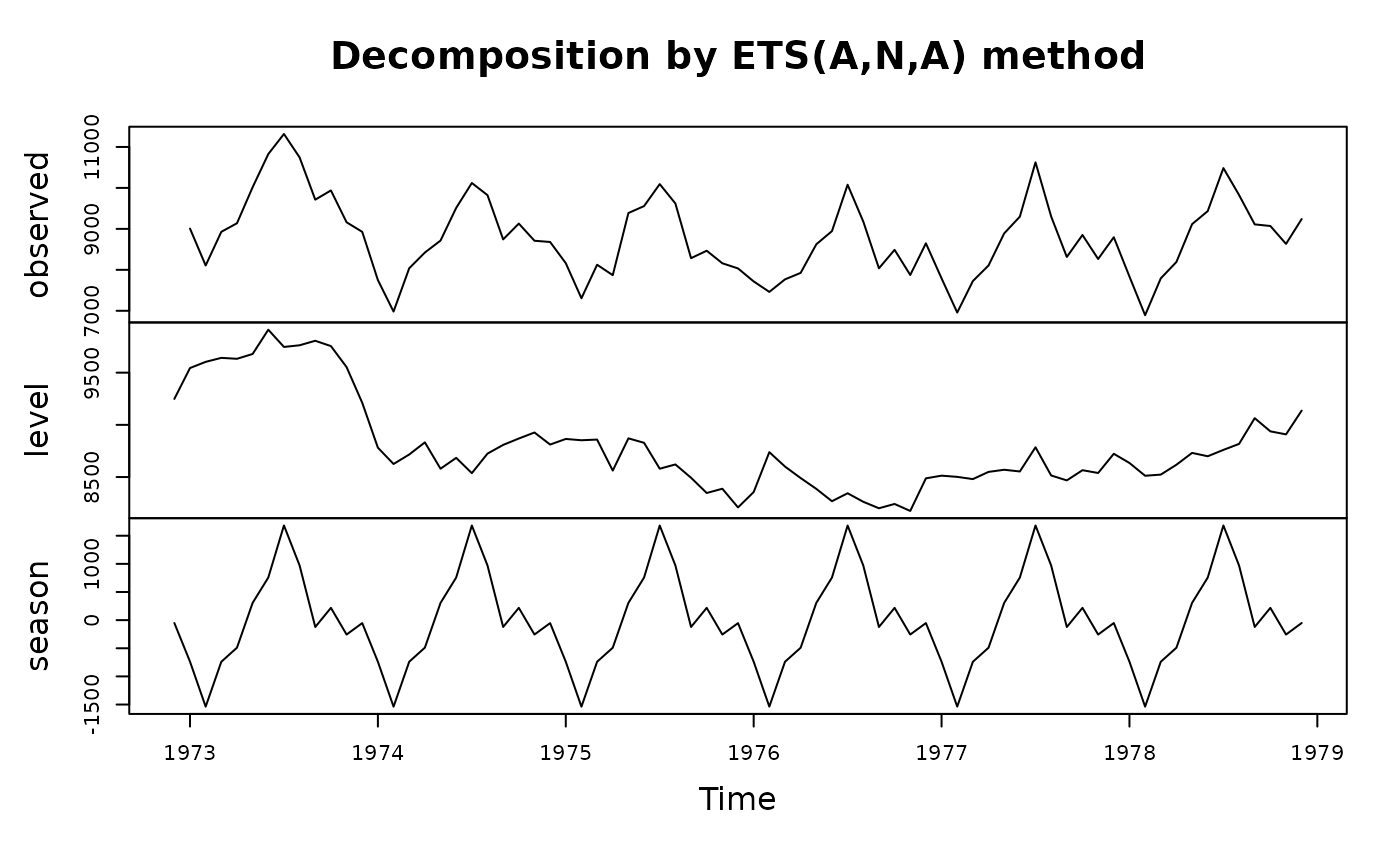
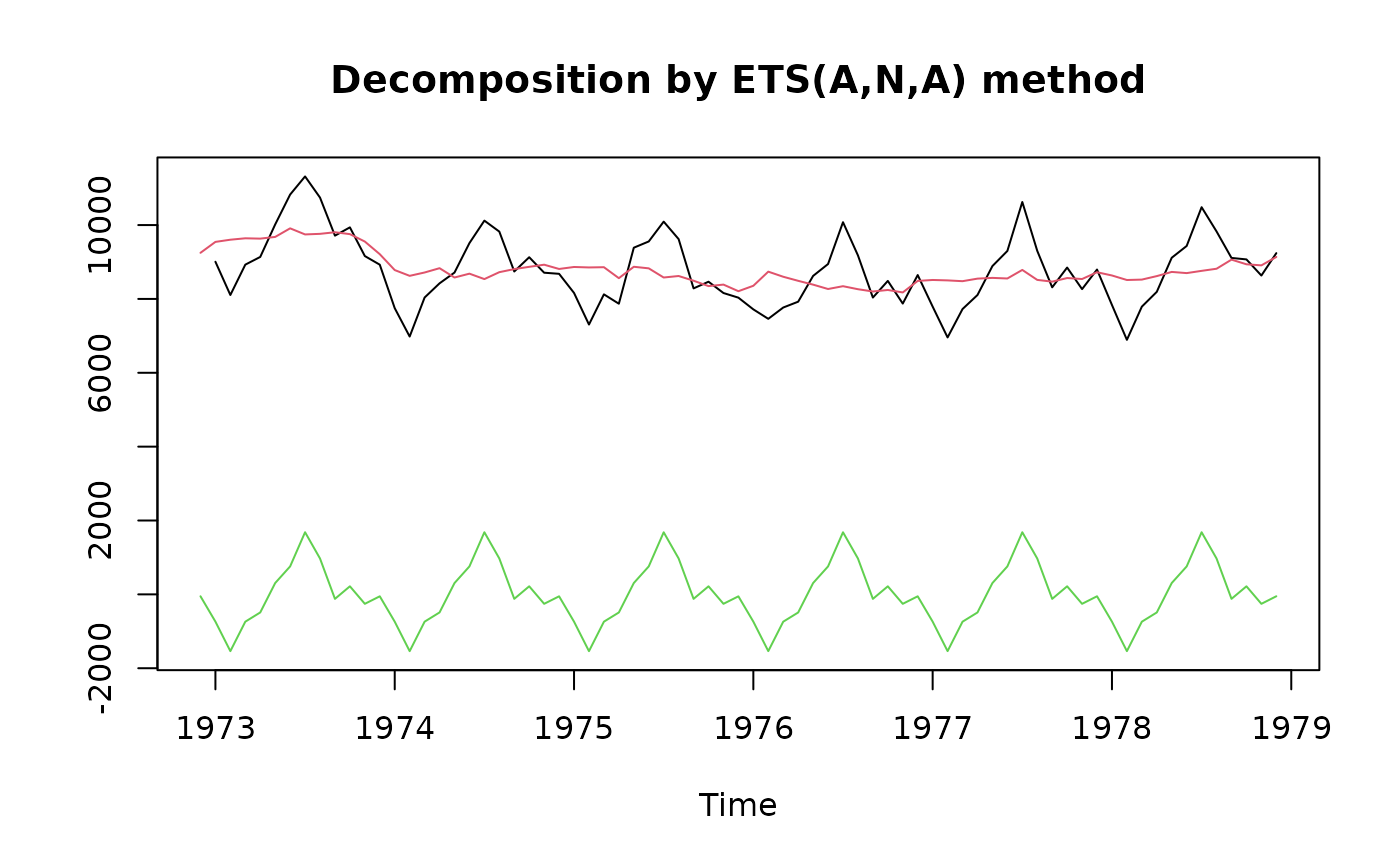
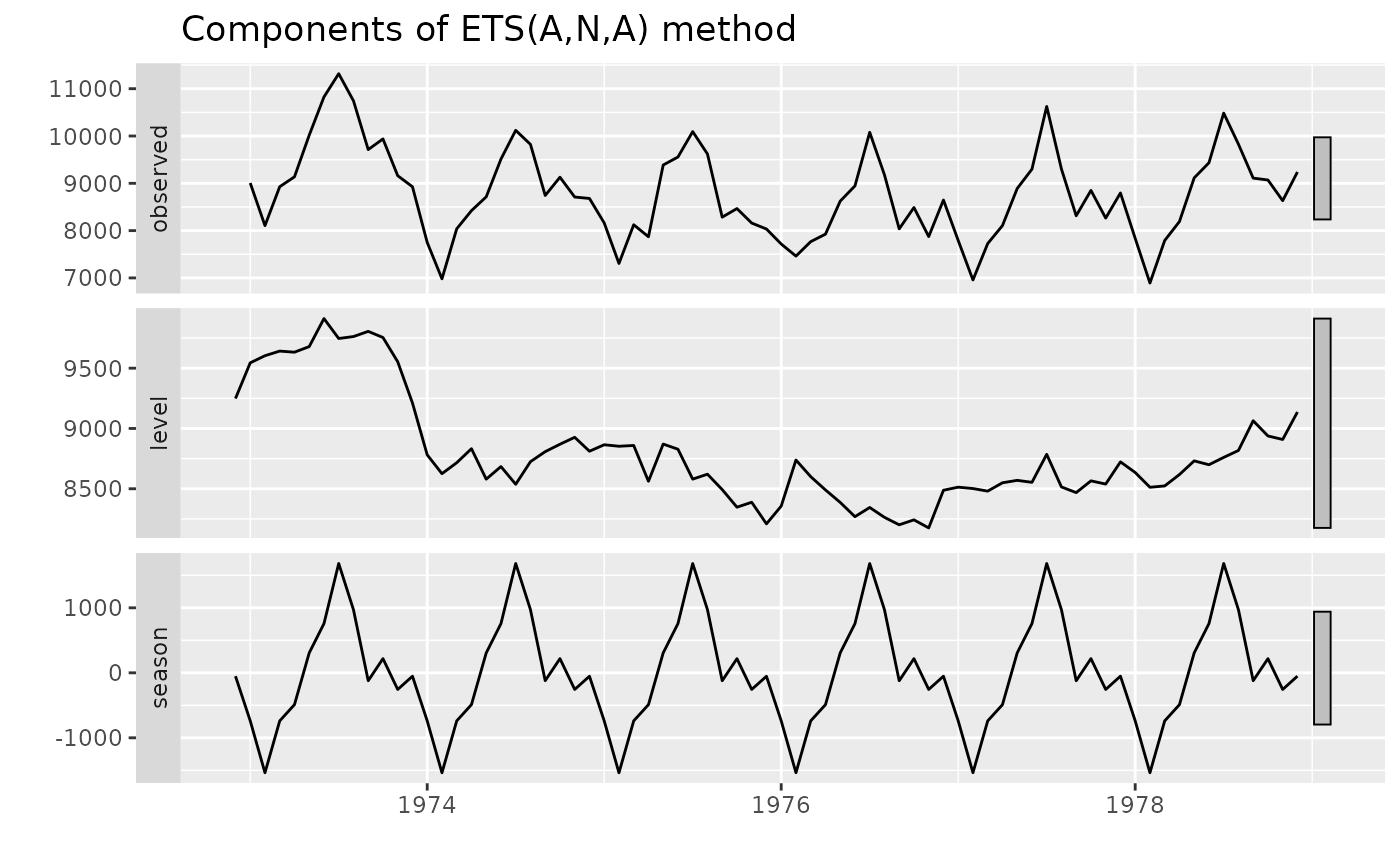
Produces a plot of the level, slope and seasonal components from an ETS model.

Usage

# S3 method for ets
plot(x, ...)

# S3 method for ets
autoplot(object, range.bars = NULL, ...)

Arguments

x

Object of class “ets”.

...

Other plotting parameters to affect the plot.

object

Object of class “ets”. Used for ggplot graphics (S3 method consistency).

range.bars

Logical indicating if each plot should have a bar at its right side representing relative size. If NULL, automatic selection takes place.

Value

None. Function produces a plot

Details

autoplot will produce an equivalent plot as a ggplot object.

See also

Author

Rob J Hyndman & Mitchell O'Hara-Wild

Examples


fit <- ets(USAccDeaths)
plot(fit)

plot(fit,plot.type="single",ylab="",col=1:3)


library(ggplot2)
autoplot(fit)