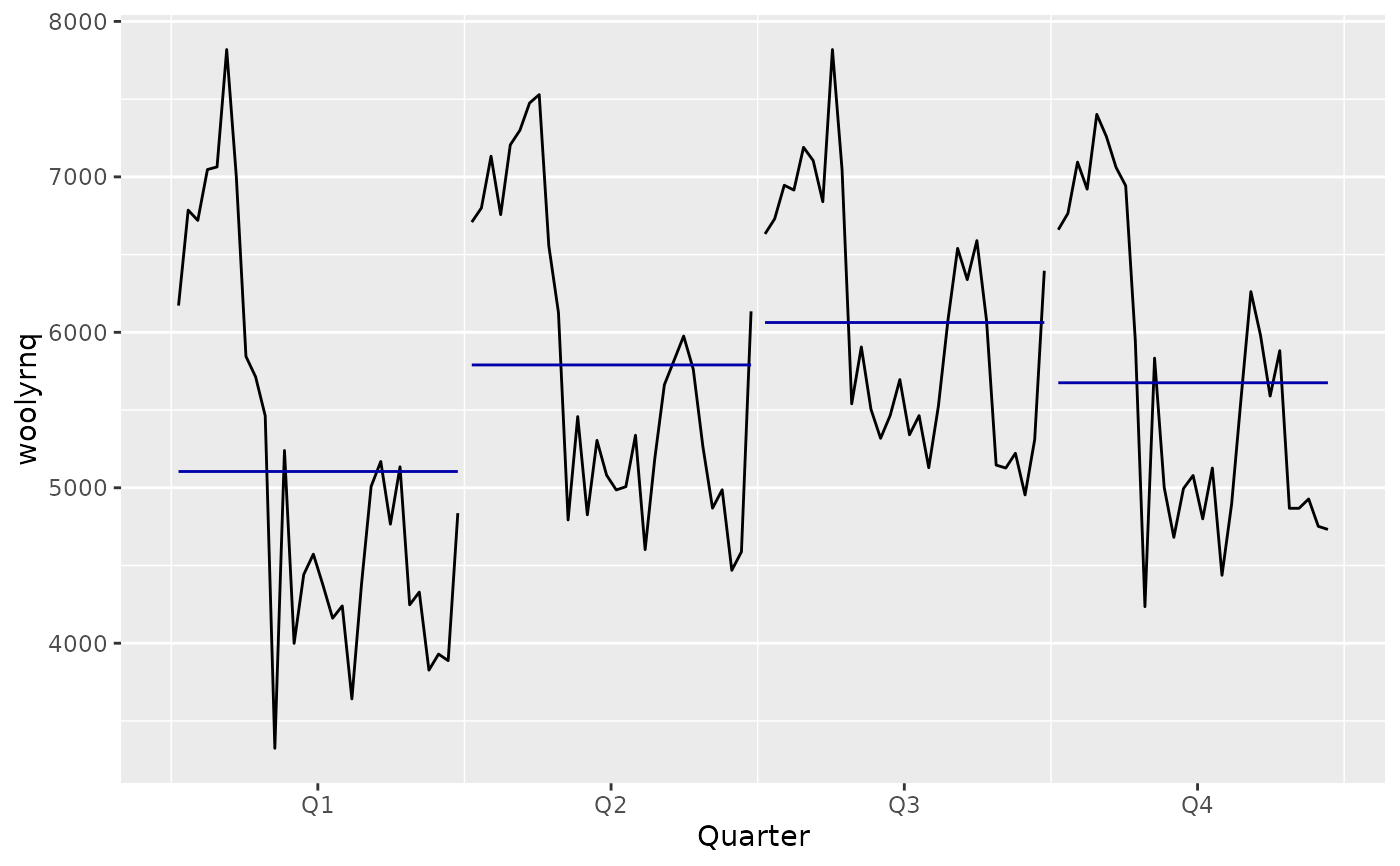
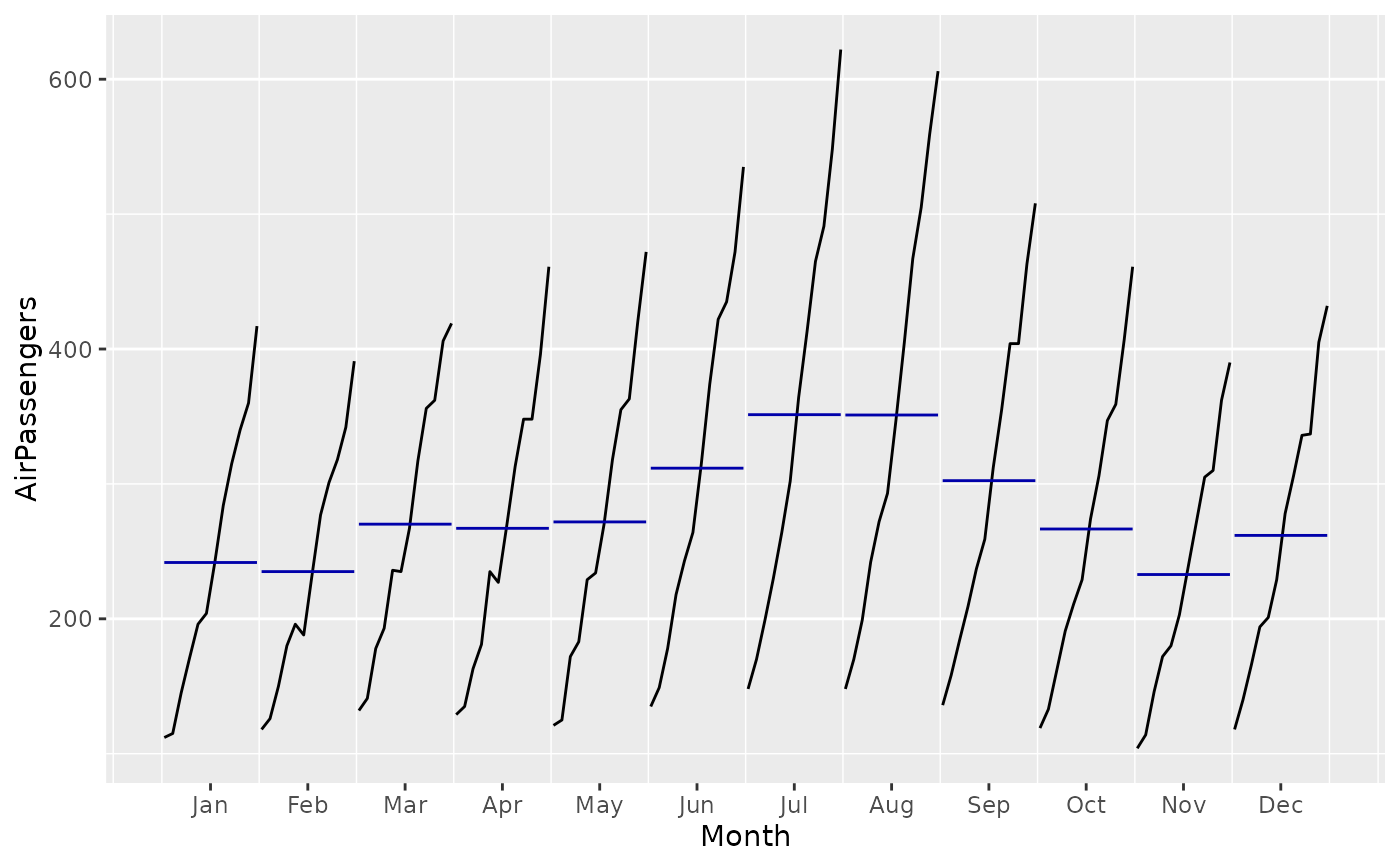
Plots a subseries plot using ggplot. Each season is plotted as a separate
mini time series. The blue lines represent the mean of the observations
within each season.
Usage
ggmonthplot(x, labels = NULL, times = time(x), phase = cycle(x), ...)

ggsubseriesplot(x, labels = NULL, times = time(x), phase = cycle(x), ...)
Arguments
- x
a time series object (type ts).
- labels
A vector of labels to use for each 'season'
- times
A vector of times for each observation
- phase
A vector of seasonal components
- ...
Not used (for consistency with monthplot)
Value
Returns an object of class ggplot.
Details
The ggmonthplot function is simply a wrapper for ggsubseriesplot as a
convenience for users familiar with stats::monthplot().
Author
Mitchell O'Hara-Wild
Examples
ggsubseriesplot(AirPassengers)

ggsubseriesplot(woolyrnq)