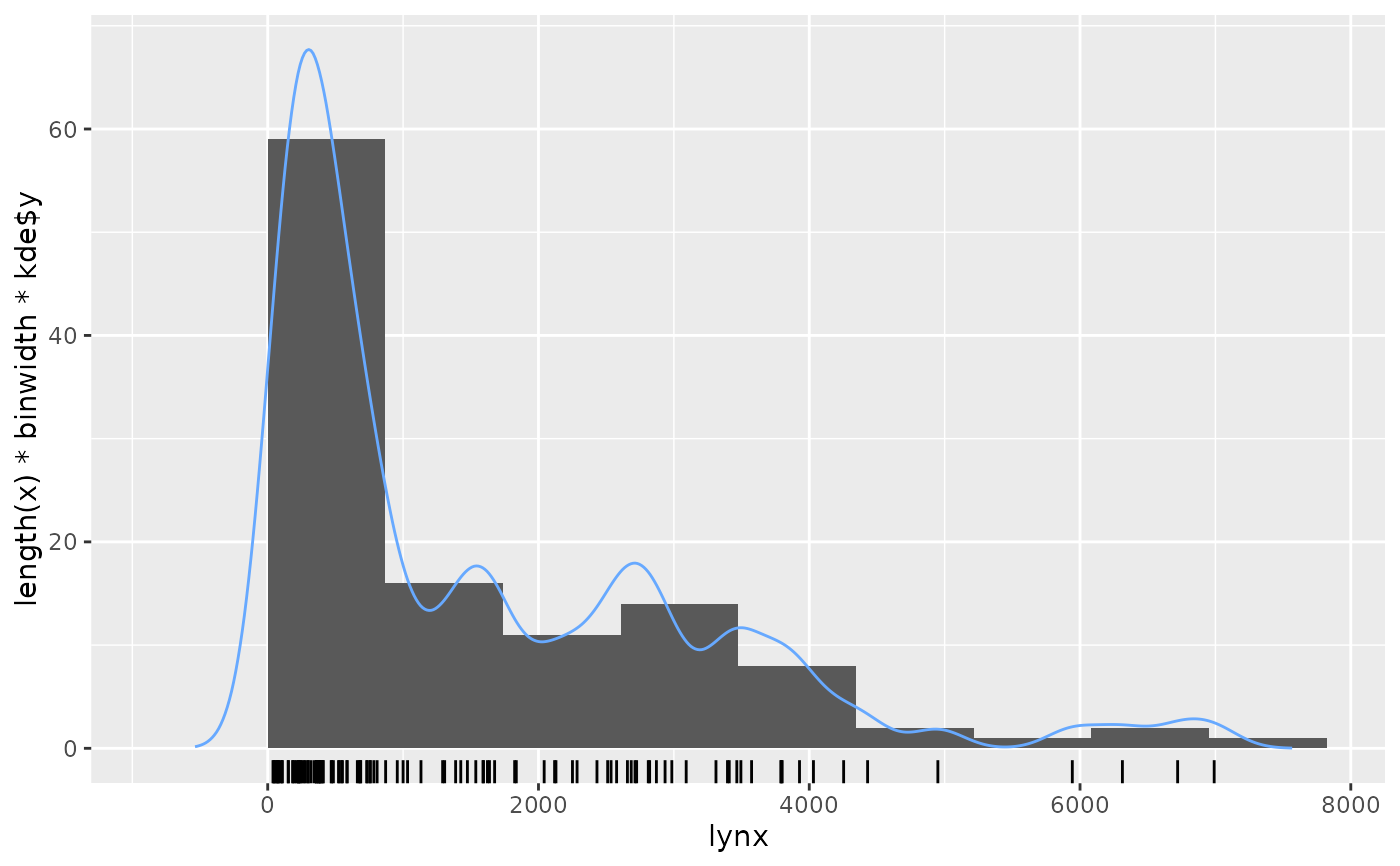
Plots a histogram and density estimates using ggplot.
Usage
gghistogram(
  x,
  add.normal = FALSE,
  add.kde = FALSE,
  add.rug = TRUE,
  bins = NULL,
  boundary = 0
)
Arguments
- x
a numerical vector.
- add.normal
Add a normal density function for comparison
- add.kde
Add a kernel density estimate for comparison
- add.rug
Add a rug plot on the horizontal axis
- bins
The number of bins to use for the histogram. Selected by default using the Friedman-Diaconis rule given by
grDevices::nclass.FD()- boundary
A boundary between two bins.