Returns forecasts and other information for univariate Holt-Winters time series models.
Arguments
- object
An object of class
HoltWinters. Usually the result of a call tostats::HoltWinters().- h
Number of periods for forecasting. Default value is twice the largest seasonal period (for seasonal data) or ten (for non-seasonal data).
- level
Confidence levels for prediction intervals.
- fan
If
TRUE,levelis set toseq(51, 99, by = 3). This is suitable for fan plots.- lambda
Box-Cox transformation parameter. If
lambda = "auto", then a transformation is automatically selected usingBoxCox.lambda. The transformation is ignored if NULL. Otherwise, data transformed before model is estimated.- biasadj
Use adjusted back-transformed mean for Box-Cox transformations. If transformed data is used to produce forecasts and fitted values, a regular back transformation will result in median forecasts. If biasadj is
TRUE, an adjustment will be made to produce mean forecasts and fitted values.- ...
Other arguments are ignored.
Details
This function calls stats::predict.HoltWinters() and constructs
an object of class forecast from the results.
It is included for completeness, but the ets() is recommended
for use instead of stats::HoltWinters.
forecast class
An object of class forecast is a list usually containing at least
the following elements:
- model
A list containing information about the fitted model
- method
The name of the forecasting method as a character string
- mean
Point forecasts as a time series
- lower
Lower limits for prediction intervals
- upper
Upper limits for prediction intervals
- level
The confidence values associated with the prediction intervals
- x
The original time series.
- residuals
Residuals from the fitted model. For models with additive errors, the residuals will be x minus the fitted values.
- fitted
Fitted values (one-step forecasts)
The function summary can be used to obtain and print a summary of the
results, while the functions plot and autoplot produce plots of the forecasts and
prediction intervals. The generic accessor functions fitted.values and residuals
extract various useful features from the underlying model.
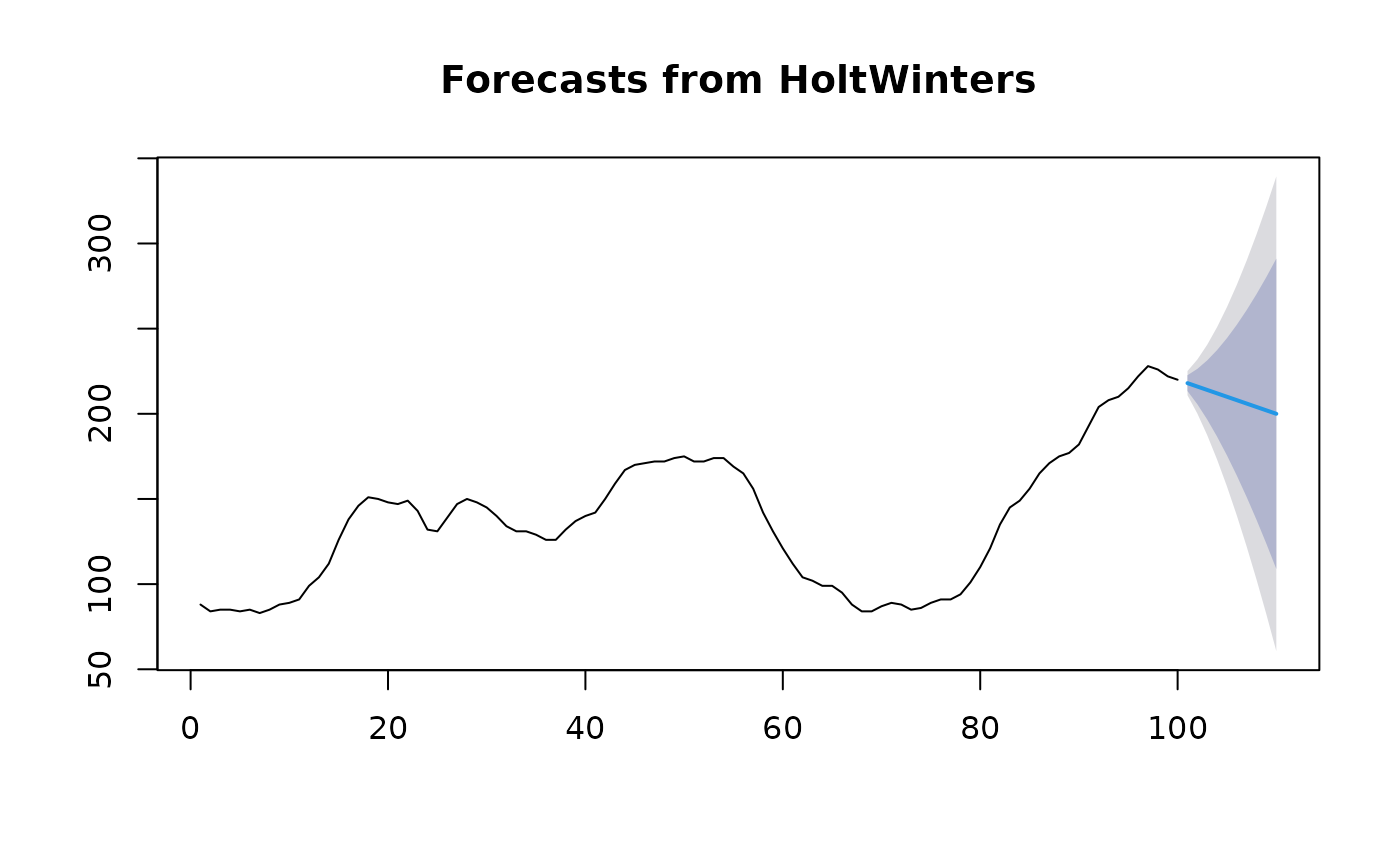
Examples
fit <- HoltWinters(WWWusage, gamma = FALSE)
plot(forecast(fit))