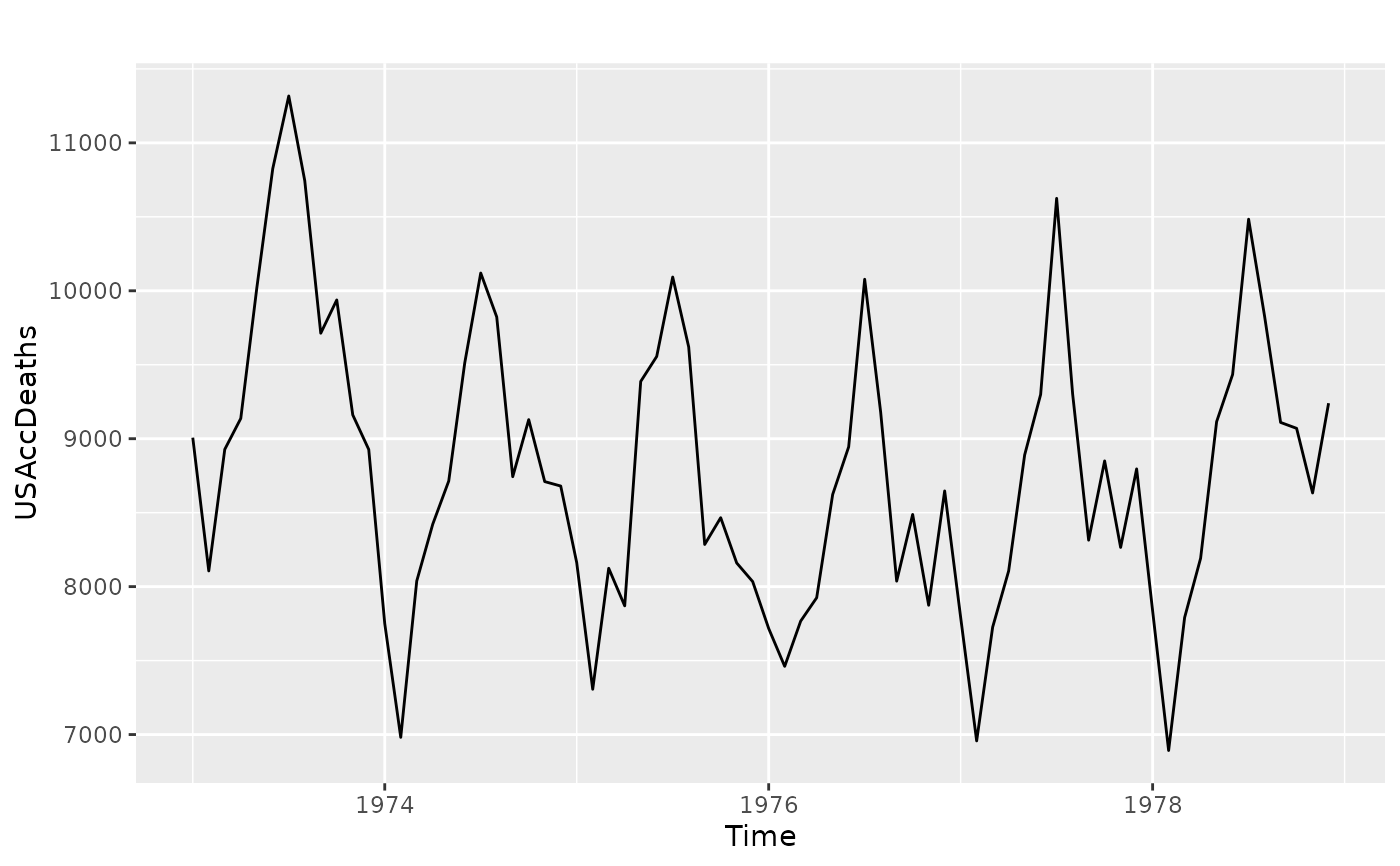
autoplot takes an object of type ts or mts and creates
a ggplot object suitable for usage with stat_forecast.
Usage
# S3 method for class 'mts'
autolayer(object, colour = TRUE, series = NULL, ...)
# S3 method for class 'msts'
autolayer(object, series = NULL, ...)
# S3 method for class 'ts'
autolayer(object, colour = TRUE, series = NULL, ...)
# S3 method for class 'ts'
autoplot(
object,
series = NULL,
xlab = "Time",
ylab = deparse1(substitute(object)),
main = NULL,
...
)
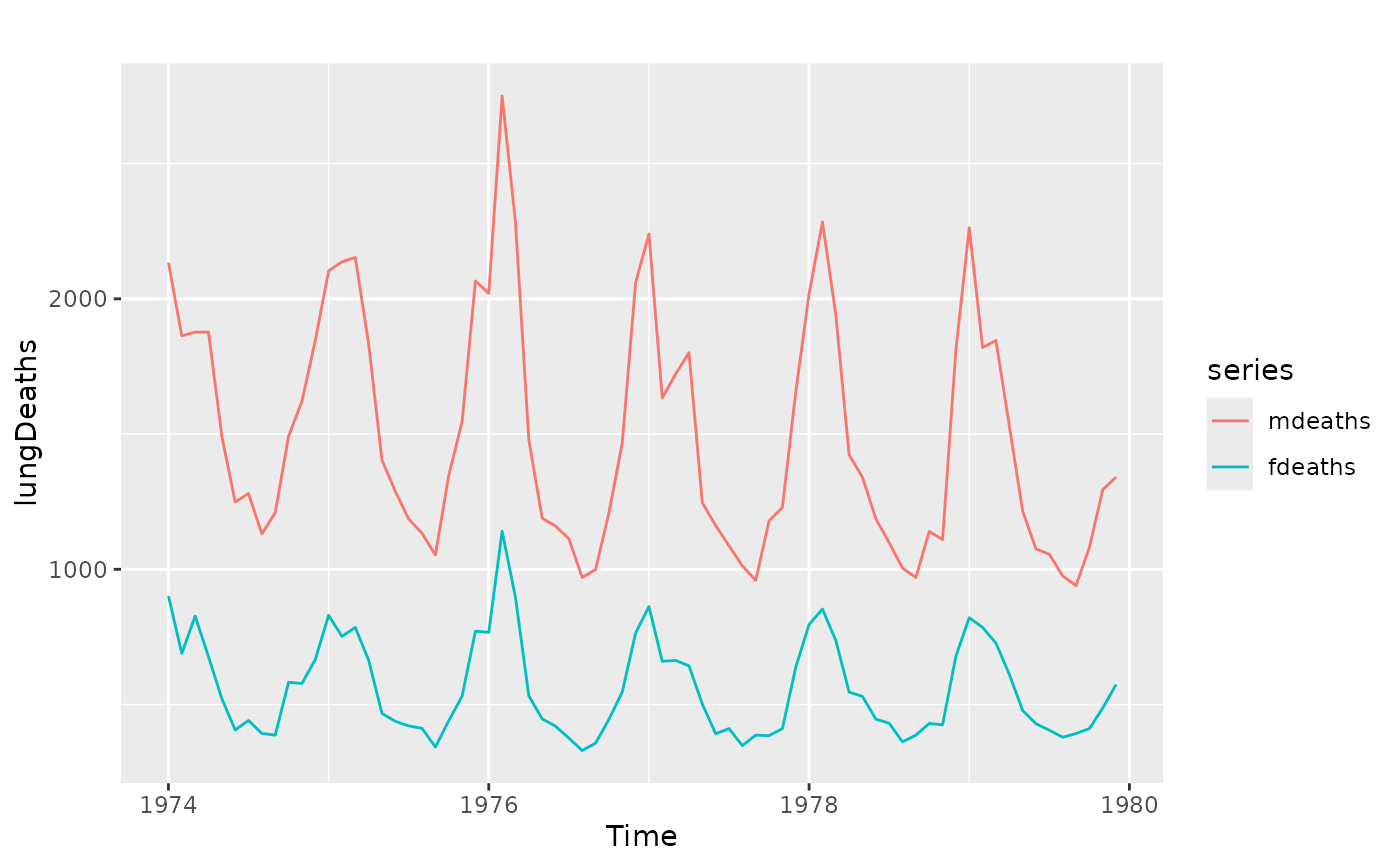
# S3 method for class 'mts'
autoplot(
object,
colour = TRUE,
facets = FALSE,
xlab = "Time",
ylab = deparse1(substitute(object)),
main = NULL,
...
)
# S3 method for class 'msts'
autoplot(object, ...)
# S3 method for class 'ts'
fortify(model, data, ...)Arguments
- object
Object of class
tsormts.- colour
If
TRUE, the time series will be assigned a colour aesthetic- series
Identifies the time series with a colour, which integrates well with the functionality of
geom_forecast().- ...
Other plotting parameters to affect the plot.
- xlab
X-axis label.
- ylab
Y-axis label.
- main
Main title.
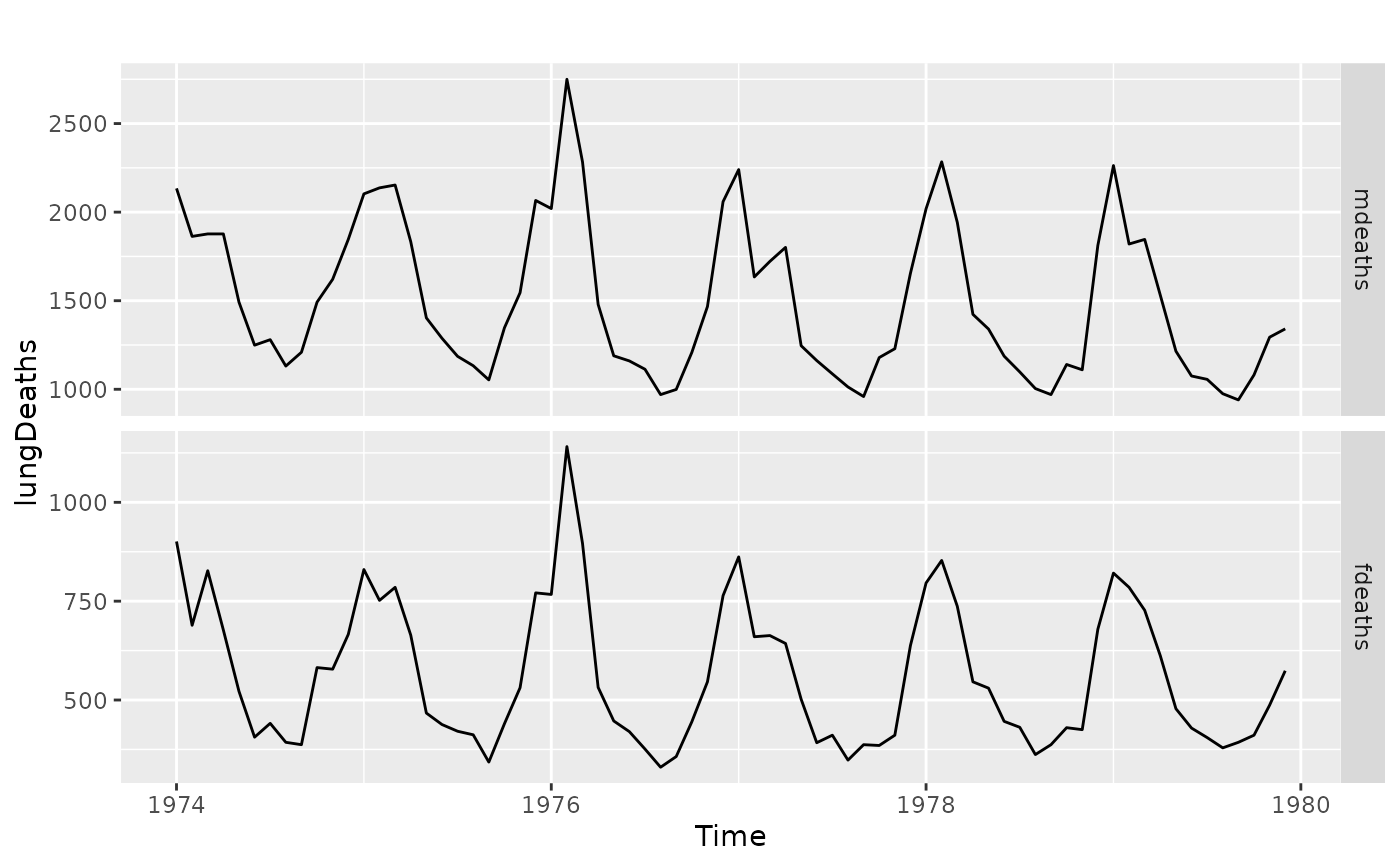
- facets
If
TRUE, multiple time series will be faceted (and unless specified, colour is set toFALSE). IfFALSE, each series will be assigned a colour.- model
Object of class
tsto be converted todata.frame.- data
Not used (required for
ggplot2::fortify()method)