CVar computes the errors obtained by applying an autoregressive
modelling function to subsets of the time series y using k-fold
cross-validation as described in Bergmeir, Hyndman and Koo (2015). It also
applies a Ljung-Box test to the residuals. If this test is significant
(see returned pvalue), there is serial correlation in the residuals and the
model can be considered to be underfitting the data. In this case, the
cross-validated errors can underestimate the generalization error and should
not be used.
Arguments
- y
Univariate time series
- k
Number of folds to use for cross-validation.
- FUN
Function to fit an autoregressive model. Currently, it only works with the
nnetar()function.- cvtrace
Provide progress information.
- blocked
choose folds randomly or as blocks?
- LBlags
lags for the Ljung-Box test, defaults to 24, for yearly series can be set to 20
- ...
Other arguments are passed to
FUN.
Value
A list containing information about the model and accuracy for each fold, plus other summary information computed across folds.
References
Bergmeir, C., Hyndman, R.J., Koo, B. (2018) A note on the validity of cross-validation for evaluating time series prediction. Computational Statistics & Data Analysis, 120, 70-83. https://robjhyndman.com/publications/cv-time-series/.
Examples
modelcv <- CVar(lynx, k = 5, lambda = 0.15)
print(modelcv)
#> Series: lynx
#> Call: CVar(y = lynx, k = 5, lambda = 0.15)
#>
#> 5-fold cross-validation
#> Mean SD
#> ME -7.399045e+01 209.5564198
#> RMSE 1.008670e+03 255.8655599
#> MAE 6.679454e+02 172.1851058
#> MPE -2.689215e+01 51.6590777
#> MAPE 6.685048e+01 36.9979203
#> ACF1 -4.401883e-03 0.1321075
#> Theil's U 1.058446e+00 0.2532232
#>
#> p-value of Ljung-Box test of residuals is 0.1454125
#> if this value is significant (<0.05),
#> the result of the cross-validation should not be used
#> as the model is underfitting the data.
print(modelcv$fold1)
#> $model
#> Series: y
#> Model: NNAR(11,6)
#> Call: FUN(y = y, lambda = 0.15, subset = trainset)
#>
#> Average of 20 networks, each of which is
#> a 11-6-1 network with 79 weights
#> options were - linear output units
#>
#> sigma^2 estimated as 0.09578
#>
#> $accuracy
#> ME RMSE MAE MPE MAPE ACF1 Theil's U
#> Test set 76.85482 1185.761 715.7763 2.319121 53.37024 0.03753834 1.303367
#>
#> $testfit
#> Time Series:
#> Start = 1821
#> End = 1934
#> Frequency = 1
#> [1] NA NA NA NA NA NA
#> [7] NA NA NA NA NA 287.19570
#> [13] 184.21320 282.91496 409.19593 2192.03796 2877.01566 3417.18384
#> [19] 2022.21189 1599.00233 149.74329 47.64919 67.24354 211.40517
#> [25] 532.11622 1052.86007 2092.77341 2549.59355 987.47308 376.91182
#> [31] 352.80268 246.88152 358.68024 741.97139 1650.64997 2654.73639
#> [37] 3219.93678 2165.79913 730.32194 301.26331 365.38976 236.18078
#> [43] 522.28826 1577.03121 3280.64184 5675.68453 4409.60188 3106.08734
#> [49] 250.89901 424.84849 370.97720 762.50398 1617.20849 1772.41723
#> [55] 2325.21047 2529.90193 767.97707 296.31146 171.03166 258.69082
#> [61] 443.41225 762.85045 1975.78213 2924.22641 4344.50209 2604.72846
#> [67] 1570.87272 149.85585 40.30856 50.70034 66.53577 139.63290
#> [73] 377.87725 585.66515 3965.98801 3512.01272 1134.45446 106.48592
#> [79] 155.49786 365.45650 770.68567 1319.06536 3391.92020 3441.94281
#> [85] 5951.02582 3771.51526 1781.75796 370.88750 382.15521 789.27459
#> [91] 1395.54100 2761.97997 3672.80097 3164.25896 2874.32795 3572.64579
#> [97] 672.93393 84.42843 53.25289 106.46359 222.59445 411.01094
#> [103] 1147.65876 1042.18121 3431.96897 2909.09436 1483.21392 498.12837
#> [109] 454.26605 707.99384 1175.52810 1648.48631 2659.55348 3352.11427
#>
#> $testset
#> [1] 1 6 8 9 10 12 20 30 41 48 56 59 67 68 72 74 77 84 99
#> [20] 104 110 111 112
#>
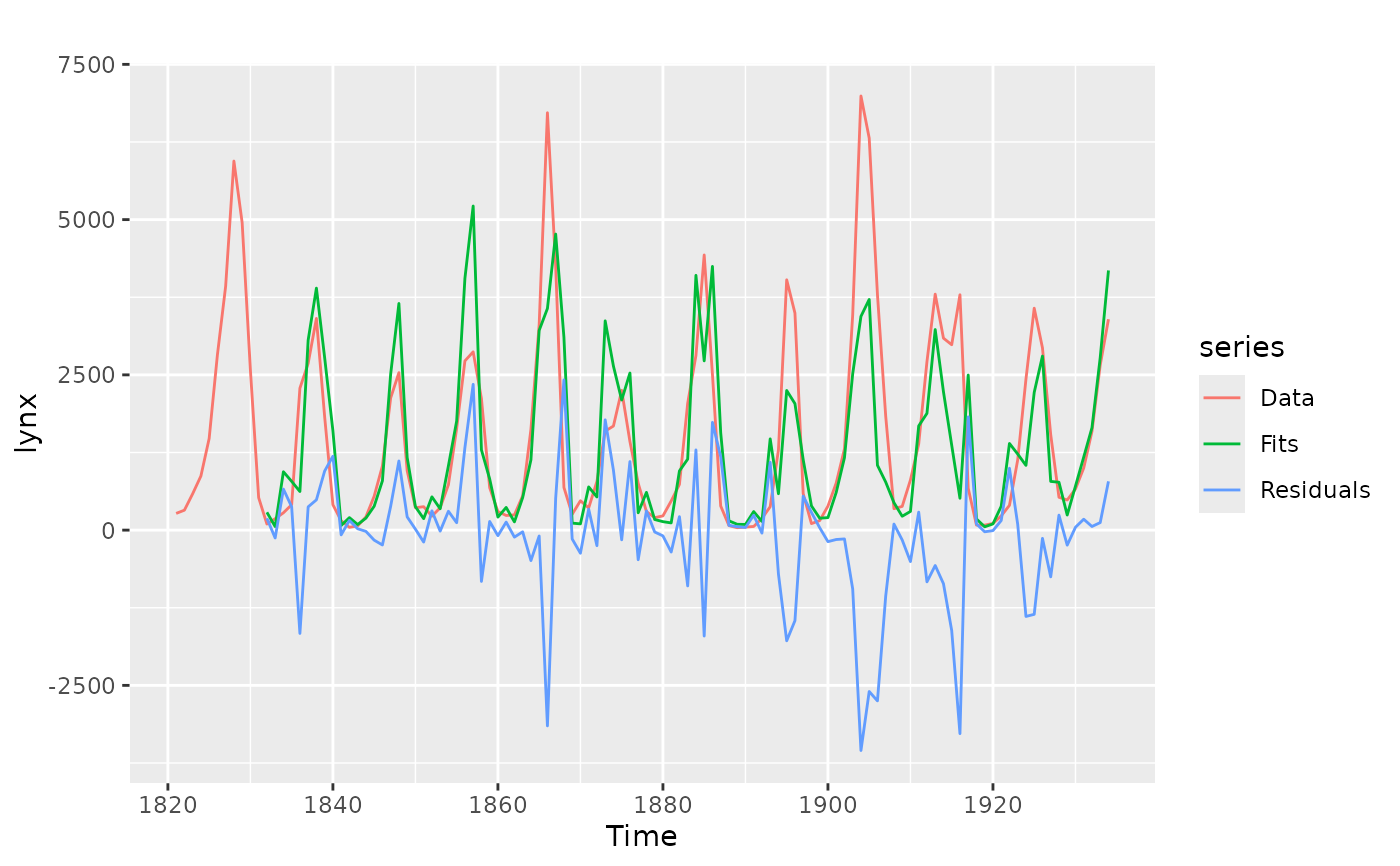
library(ggplot2)
autoplot(lynx, series = "Data") +
autolayer(modelcv$testfit, series = "Fits") +
autolayer(modelcv$residuals, series = "Residuals")
#> Warning: Removed 11 rows containing missing values or values outside the scale range
#> (`geom_line()`).
#> Warning: Removed 11 rows containing missing values or values outside the scale range
#> (`geom_line()`).
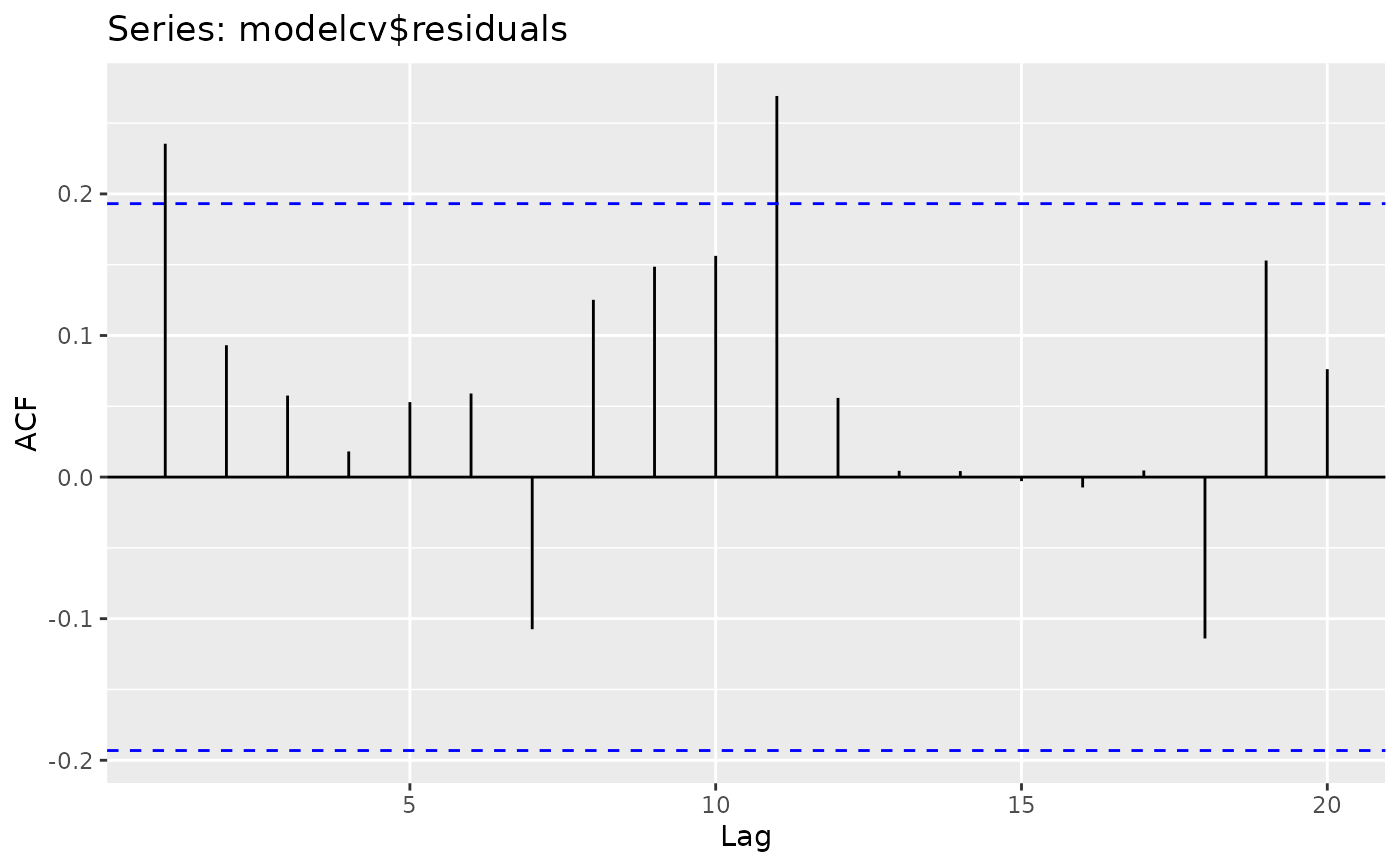
 ggAcf(modelcv$residuals)