Mortality rates and populations for Australia and Australian states. The
data can be plotted and modelled using the functions in the demography
package such as plot.demogdata and
fdm.
Format
All data are demogdata objects containing the following
components:
- year
Years for which data available
- age
Ages for which data available
- rates
A list with matrix components
female,maleandtotalwith one age group per row and one column per year.- pop
A list of the same form as
ratesbut containing population numbers instead of mortality rates.- type
A character string equal to
"mortality"in each case.- label
A character string giving the geographical region.
Source
Smith, L. (2009) The Australian Demographic Data Bank, 1901-2003: Populations [Computer File]. Canberra: Australian Social Science Data Archive, The Australian National University, 2009. Smith, L. (2009) The Australian Demographic Data Bank, 1901-2003: Deaths [Computer File]. Canberra: Australian Social Science Data Archive, The Australian National University, 2009.
Details
The following data sets are included:
australia | Australia | (1901-2003) |
nsw | New South Wales | (1901-2003) |
vic | Victoria | (1901-2003) |
qld | Queensland | (1901-2003) |
sa | South Australia | (1901-2003) |
wa | Western Australia | (1901-2003) |
nt | Northern Territory | (1901-2003) |
actot | Australian Capital Territory and overseas territories | (1901-2003) |
tas | Tasmania | (1901-2003) |
All data are from v3.2b of the Australian Demographic Data Bank released 10 February 2005.
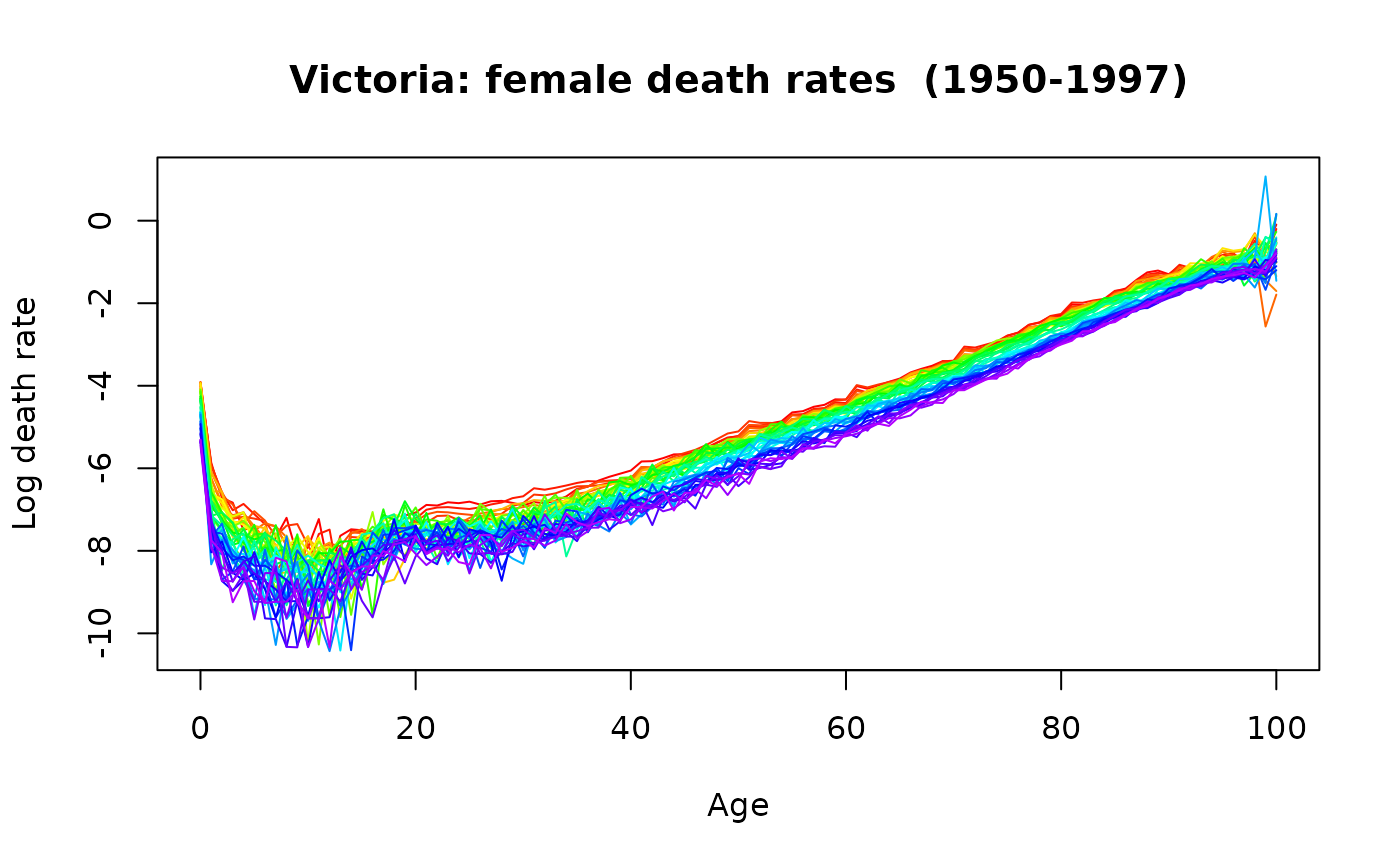
Examples
plot(vic,years=1950:1997)