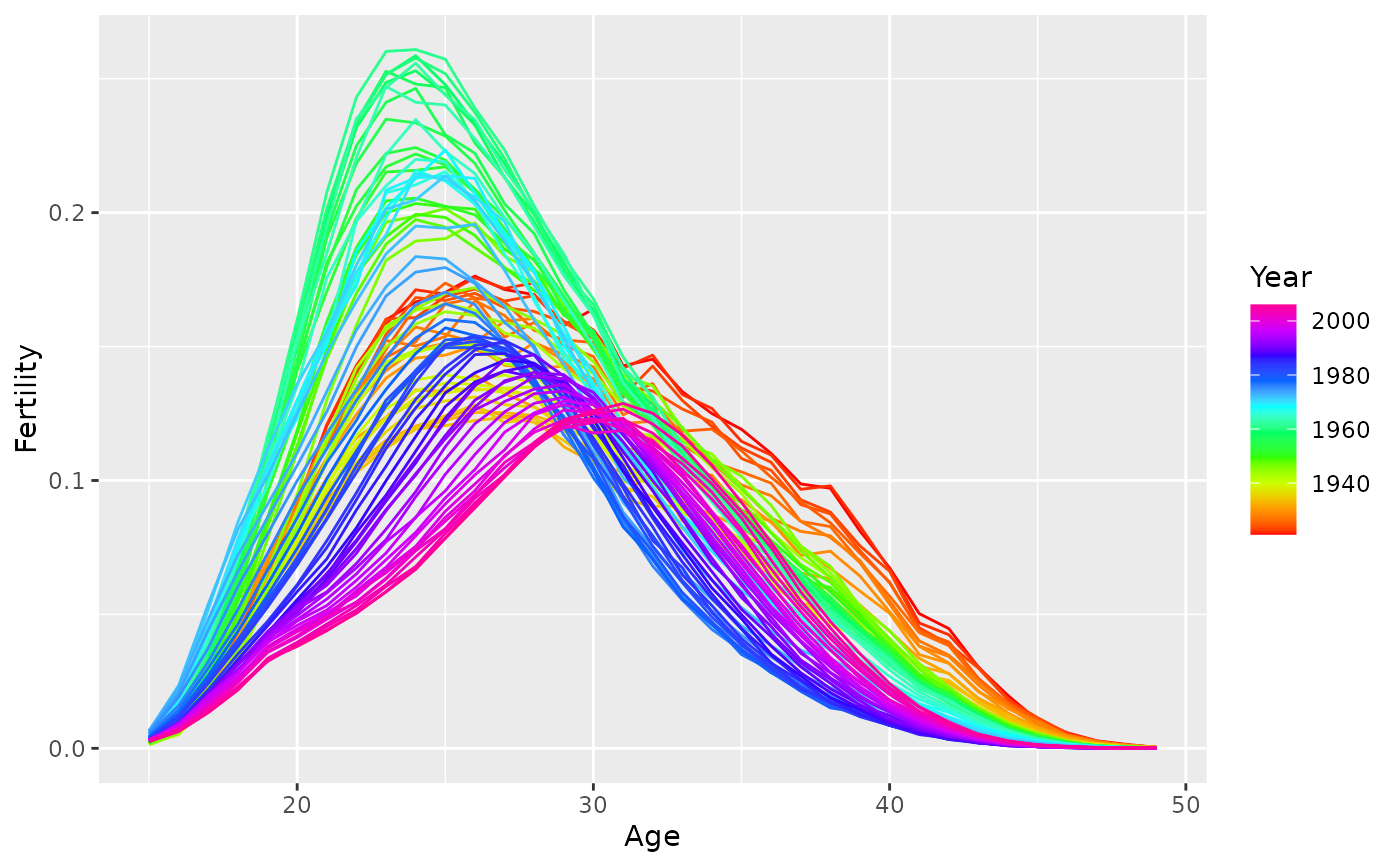
Produce rainbow plot (coloured by time index) of demographic variable against against age.
Usage
# S3 method for class 'vital'
autoplot(object, .vars = NULL, age = age_var(object), ...)References
Hyndman, Rob J & Shang, Han Lin (2010) Rainbow plots, bagplots, and boxplots for functional data. Journal of Computational and Graphical Statistics, 19(1), 29-45. https://robjhyndman.com/publications/rainbow-fda/
Examples
autoplot(norway_fertility, Fertility)