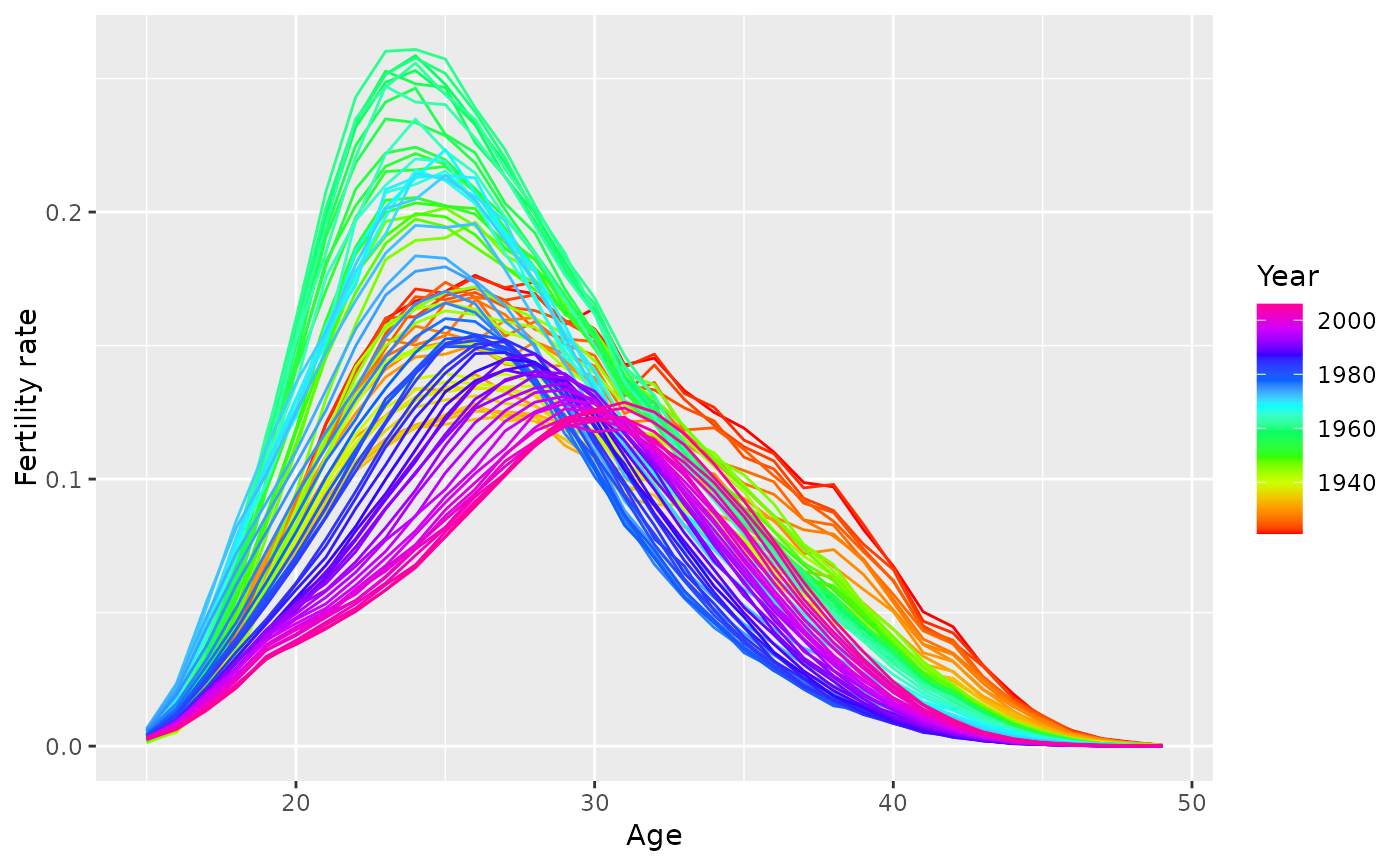
aus_fertility is an annual vital object covering the years 1921-2002 with three values:
| Fertility: | Fertility rate per woman |
| Exposure: | Population of women at 30 June each year |
| Births: | Number of births |
Source
Australian Human Mortality Database. https://aushd.org
Details
The data is disaggregated using one key:
| Age: | Age of mother at time of birth |
The extreme age groups (15 and 49) also include a few younger and older mothers respectively.
Examples
library(ggplot2)
aus_fertility
#> # A vital: 3,010 x 5 [1Y]
#> # Key:     Age [35 x 1]
#>     Year   Age Fertility Exposure Births
#>    <int> <int>     <dbl>    <dbl>  <dbl>
#>  1  1921    15   0.00175    49228   86.1
#>  2  1921    16   0.00685    47779  327.
#>  3  1921    17   0.0183     45894  839.
#>  4  1921    18   0.0399     45683 1824.
#>  5  1921    19   0.0676     43364 2931.
#>  6  1921    20   0.0914     47016 4297.
#>  7  1921    21   0.120      48023 5787.
#>  8  1921    22   0.142      46368 6566.
#>  9  1921    23   0.16       45123 7220.
#> 10  1921    24   0.167      46709 7782.
#> # ℹ 3,000 more rows
aus_fertility |>
  autoplot(Fertility) +
  ylab("Fertility rate")