FNAIVE() returns an random walk functional model applied to the formula's response variable as a function of age.
Examples
fnaive <- norway_mortality |>
  dplyr::filter(Sex == "Female") |>
  model(fit = FNAIVE(Mortality))
report(fnaive)
#> Series: Mortality
#> Model: FNAIVE
#>
#> # A tibble: 111 × 2
#>      Age    sigma
#>    <int>    <dbl>
#>  1     0 0.00287
#>  2     1 0.00124
#>  3     2 0.000740
#>  4     3 0.000503
#>  5     4 0.000402
#>  6     5 0.000413
#>  7     6 0.000323
#>  8     7 0.000257
#>  9     8 0.000260
#> 10     9 0.000279
#> # ℹ 101 more rows
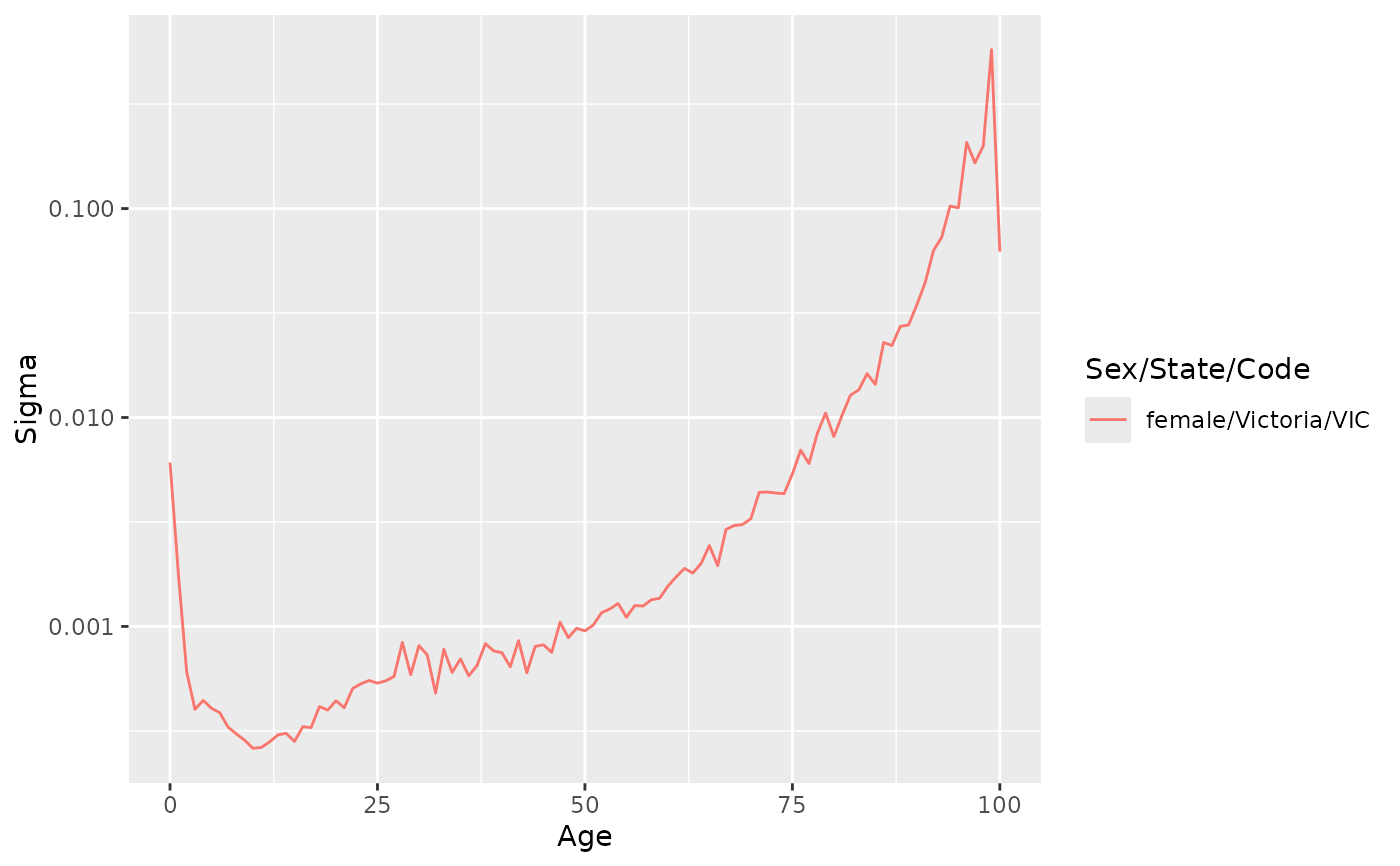
autoplot(fnaive) + ggplot2::scale_y_log10()
