Skip to contents

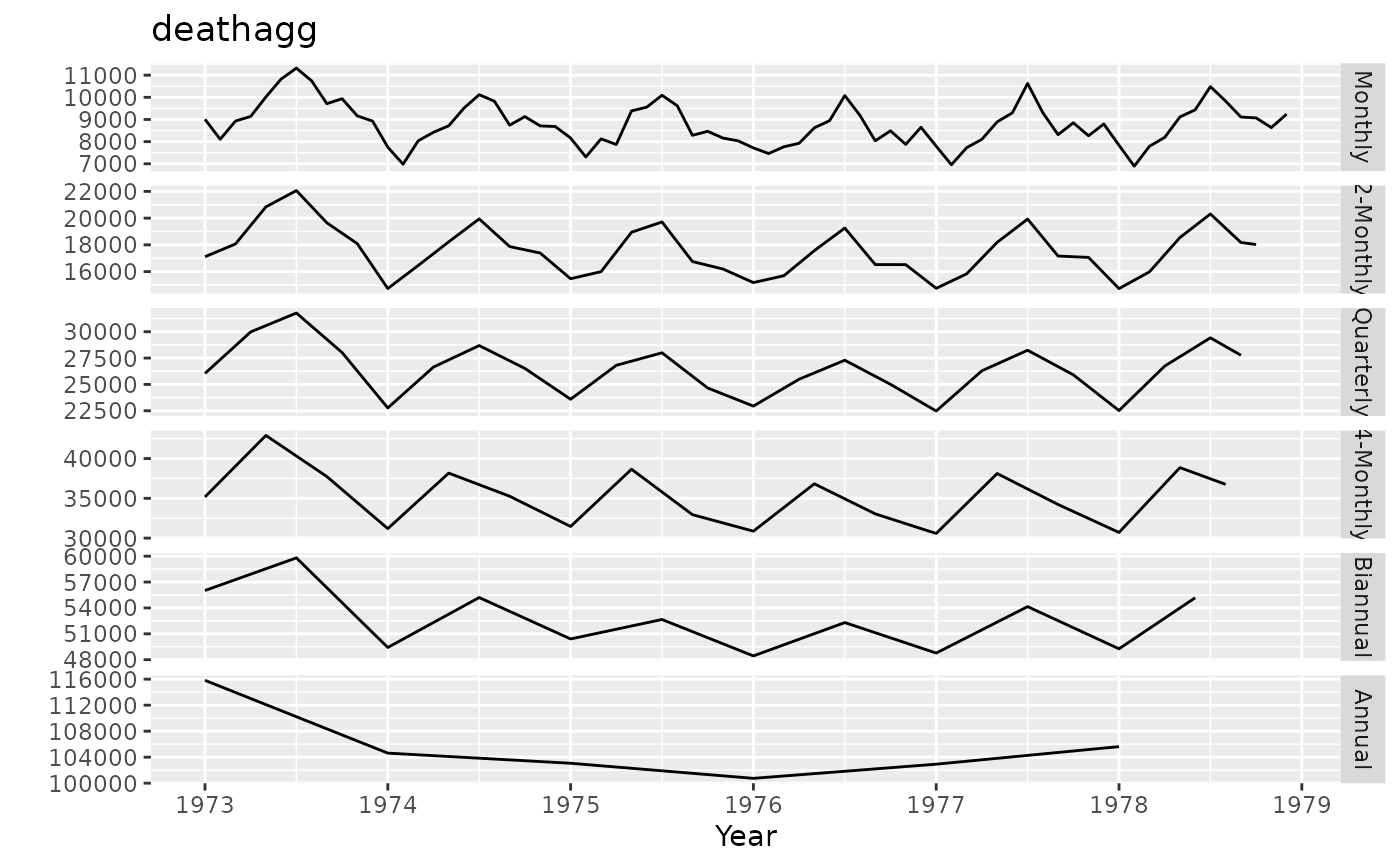
Plots all temporal aggregations of a time series

Usage

# S3 method for tsaggregates
plot(x, series = "all", ...)

# S3 method for tsaggregates
autoplot(object, series = "all", ...)

Arguments

x

tsaggregates object, produced by tsaggregates.

series

The indexes of the series to plot. By default, all series are plotted.

...

Other arguments passed to plot.ts or autoplot.ts.

object

tsaggregates object, produced by tsaggregates.

Author

Rob J Hyndman

Examples

deathagg <- tsaggregates(USAccDeaths)
plot(deathagg, series=c(1,2,4,6))


library(ggplot2)
autoplot(deathagg)