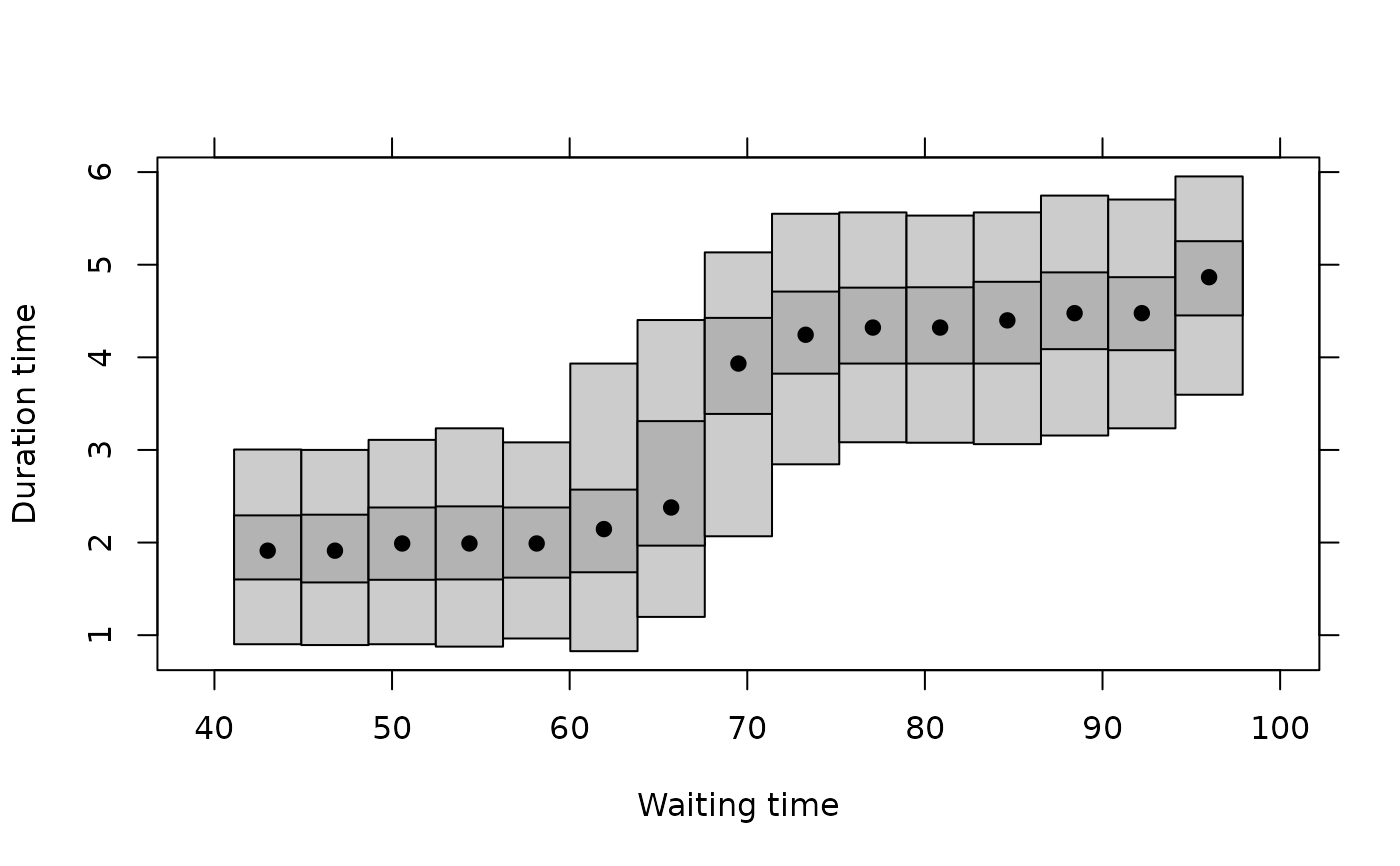
Plots highest density regions continuously over some conditioned variable.
Source:R/plotcde.R
plot.hdrcde.RdPlots highest density regions continuously over some conditioned variable.
Usage
# S3 method for class 'hdrcde'
plot(
  x,
  plot.modes = TRUE,
  mden,
  threshold = 0.05,
  xlim,
  ylim,
  xlab,
  ylab,
  border = TRUE,
  font = 1,
  cex = 1,
  ...
)
Arguments
- x
Output from
hdr.cde().- plot.modes
Should modes be plotted as well as HDRs?
- mden
Marginal density in the
xdirection. When small, the HDRs won't be plotted. Default is uniform so all HDRs are plotted.- threshold
Threshold for margin density. HDRs are not plotted if the margin density
mdenis lower than this value.- xlim
Limits for x-axis.
- ylim
Limits for y-axis.
- xlab
Label for x-axis.
- ylab
Label for y-axis.
- border
Show border of polygons
- font
Font to be used in plot.
- cex
Size of characters.
- ...
Other arguments passed to plotting functions.