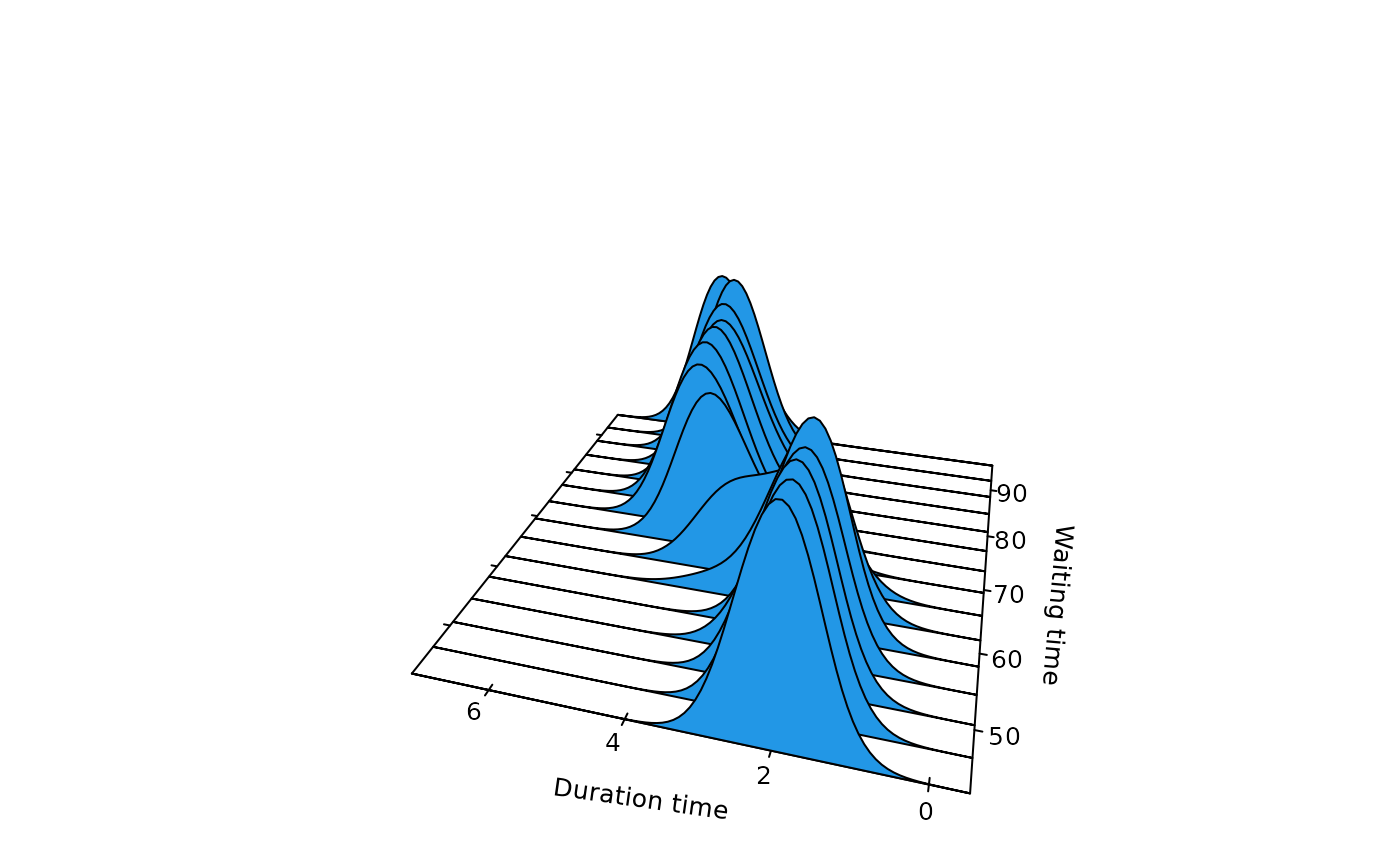
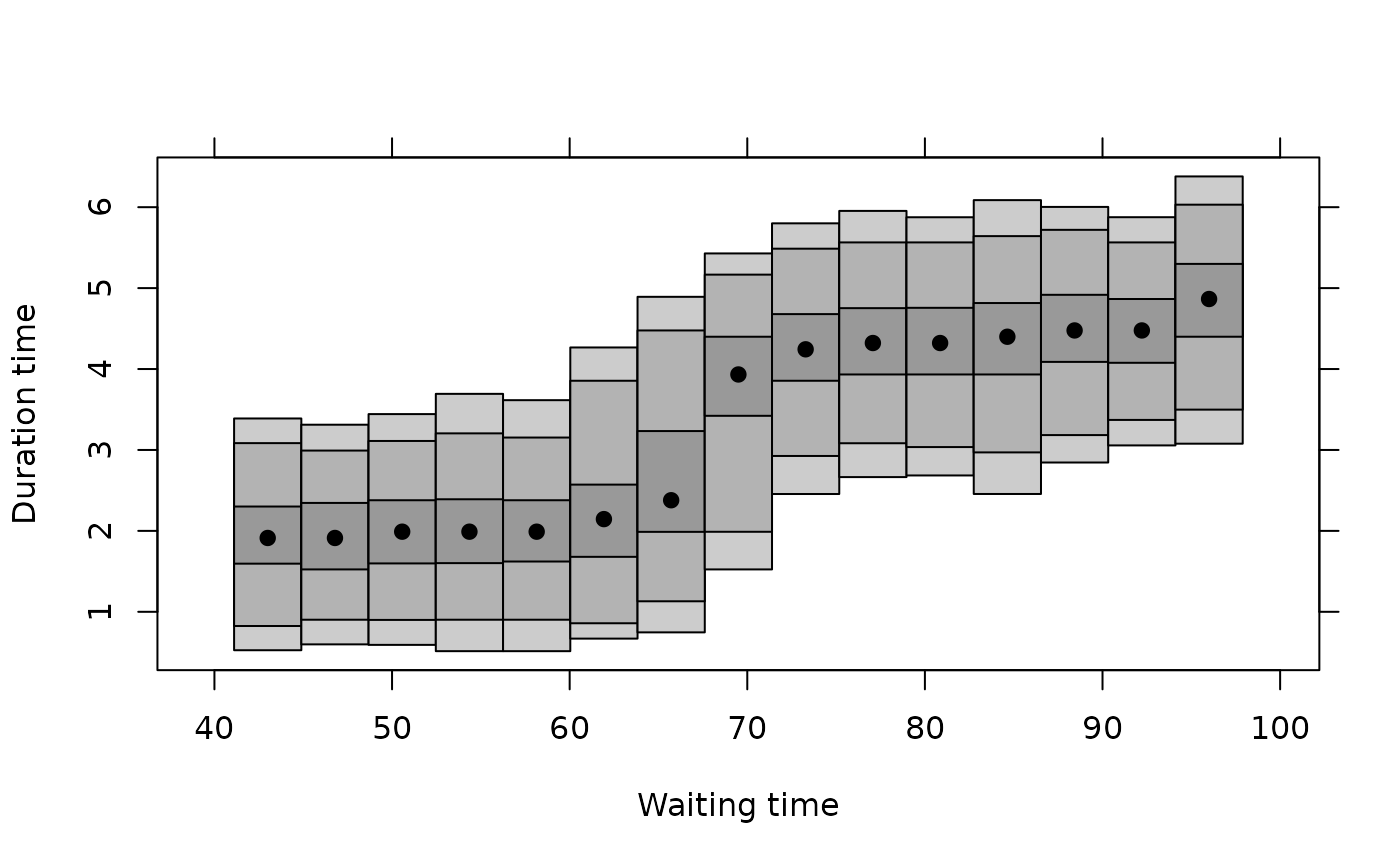
Produces stacked density plots or highest density region plots for a univariate density conditional on one covariate.
Arguments
- x
Output from
cde().- firstvar
If there is more than one conditioning variable,
firstvarspecifies which variable to fix first.- mfrow
If there is more than one conditioning variable,
mfrowis passed tographics::par()before plotting.- plot.fn
Specifies which plotting function to use: "stacked" results in stacked conditional densities and "hdr" results in highest density regions.
- x.name
Name of x (conditioning) variable for use on x-axis.
- margin
Marginal density of conditioning variable. If present, only conditional densities corresponding to non-negligible marginal densities will be plotted.
- ...
Additional arguments to plot.
Value
If plot.fn=="stacked" and there is only one conditioning
variable, the function returns the output from
graphics::persp(). If plot.fn=="hdr" and there is only
one conditioning variable, the function returns the output from
hdr.cde(). When there is more than one conditioning variable,
nothing is returned.