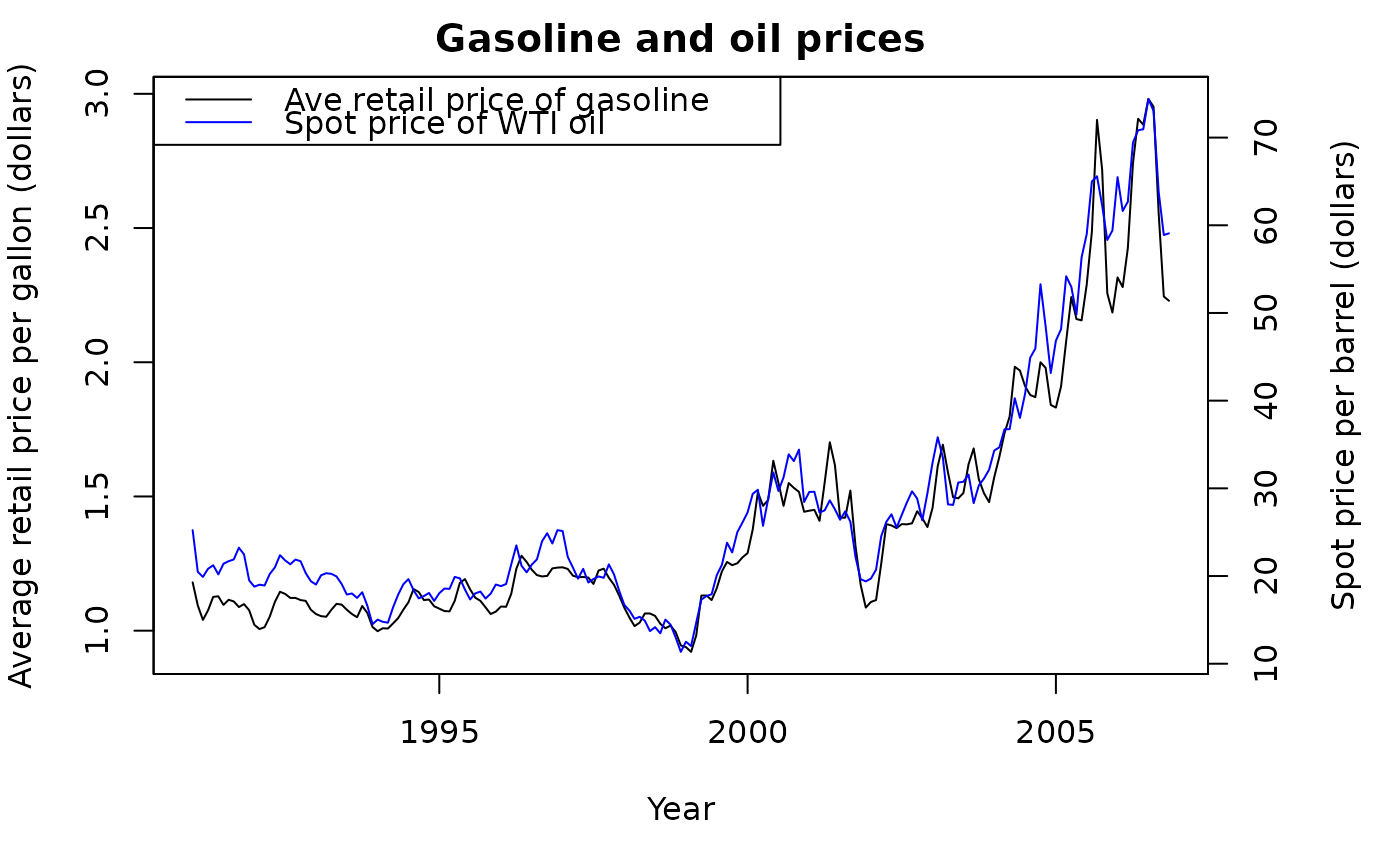
Monthly US retail gasoline price (the average price per gallon, in dollars) and the spot price of a barrel of West Texas Intermediate (WTI) oil in dollars as traded at Cushing, Oklahoma. Jan 1991 - Nov 2006.
Source
Hyndman, R.J., Koehler, A.B., Ord, J.K., and Snyder, R.D., (2008) Forecasting with exponential smoothing: the state space approach, Springer.
References
https://robjhyndman.com/expsmooth/. These series were obtained from the US Energy Information Administration website https://www.eia.gov.
Examples
par(mar = c(5, 4, 2, 5))
plot(gasprice[, 1],
  xlab = "Year", ylab = "Average retail price per gallon (dollars)",
  main = "Gasoline and oil prices"
)
par(new = TRUE)
plot(gasprice[, 2], col = "blue", xaxt = "n", yaxt = "n", xlab = "", ylab = "")
axis(4)
mtext("Spot price per barrel (dollars)", side = 4, line = 3)
legend("topleft",
  col = c("black", "blue"), lty = 1,
  legend = c("Ave retail price of gasoline", "Spot price of WTI oil")
)