Surprisals and surprisal probabilities computed from a model
Source:R/surprisals_models.R
surprisals_model.RdA surprisal is given by \(s = -\log f(y)\) where \(f\) is the
density or probability mass function of the estimated or assumed distribution,
and \(y\) is an observation. This is returned by surprisals().
A surprisal probability is the probability of a surprisal at least as extreme
as \(s\). This is returned by surprisals_prob()
Usage
# S3 method for class 'lm'
surprisals(object, loo = FALSE, ...)

# S3 method for class 'glm'
surprisals(object, ...)

# S3 method for class 'gam'
surprisals(object, ...)

# S3 method for class 'lm'
surprisals_prob(
  object,
  approximation = c("none", "gpd", "empirical", "rank"),
  threshold_probability = 0.1,
  loo = FALSE,
  ...
)

# S3 method for class 'glm'
surprisals_prob(
  object,
  approximation = c("none", "gpd", "empirical", "rank"),
  threshold_probability = 0.1,
  ...
)

# S3 method for class 'gam'
surprisals_prob(
  object,
  approximation = c("none", "gpd", "empirical", "rank"),
  threshold_probability = 0.1,
  ...
)
Arguments
- object
A model object such as returned by
lm,glm, orgam. This includes a specified conditional probability distribution which is used to compute surprisal values.- loo
Should leave-one-out surprisals be computed? For computational reasons, this is only available for
lmobjects.- ...
Other arguments are ignored.
- approximation
Character string specifying the method to use in computing the surprisal probabilities. See Details below.
- threshold_probability
Probability threshold when computing the GPD approximation. This is the probability below which the GPD is fitted. Only used if
approximation = "gpd".
Details
The surprisal probabilities may be computed in three different ways.
When
approximation = "none"(the default), the surprisal probabilities are computed using the same distribution that was used to compute the surprisal values. Under this option, surprisal probabilities are equal to 1 minus the coverage probability of the largest HDR that contains each value. Surprisal probabilities smaller than 1e-6 are returned as 1e-6.When
approximation = "gdp", the surprisal probabilities are computed using a Generalized Pareto Distribution fitted to the most extreme surprisal values (those with probability less thanthreshold_probability). For surprisal probabilities greater thanthreshold_probability, the value ofthreshold_probabilityis returned. Under this option, the distribution is used for computing the surprisal values but not for determining their probabilities. Due to extreme value theory, the resulting probabilities should be relatively insensitive to the distribution used in computing the surprisal values.When
approximation = "empirical"(or"rank"), the surprisal probability of each observation is estimated using the proportion of observations with greater or equal surprisal values. This is a nonparametric approach that is also insensitive to the distribution used in computing the surprisal values.
References
Hyndman, R J (2026) "That's weird: Anomaly detection using R", Chapter 7, https://OTexts.com/weird/.
Hyndman, R J & Frazier, D T (2026) "Anomaly detection using surprisals", https://robjhyndman.com/publications/surprisals.html.
See also
For specific methods, see surprisals.numeric() and surprisals.lm(),
Examples
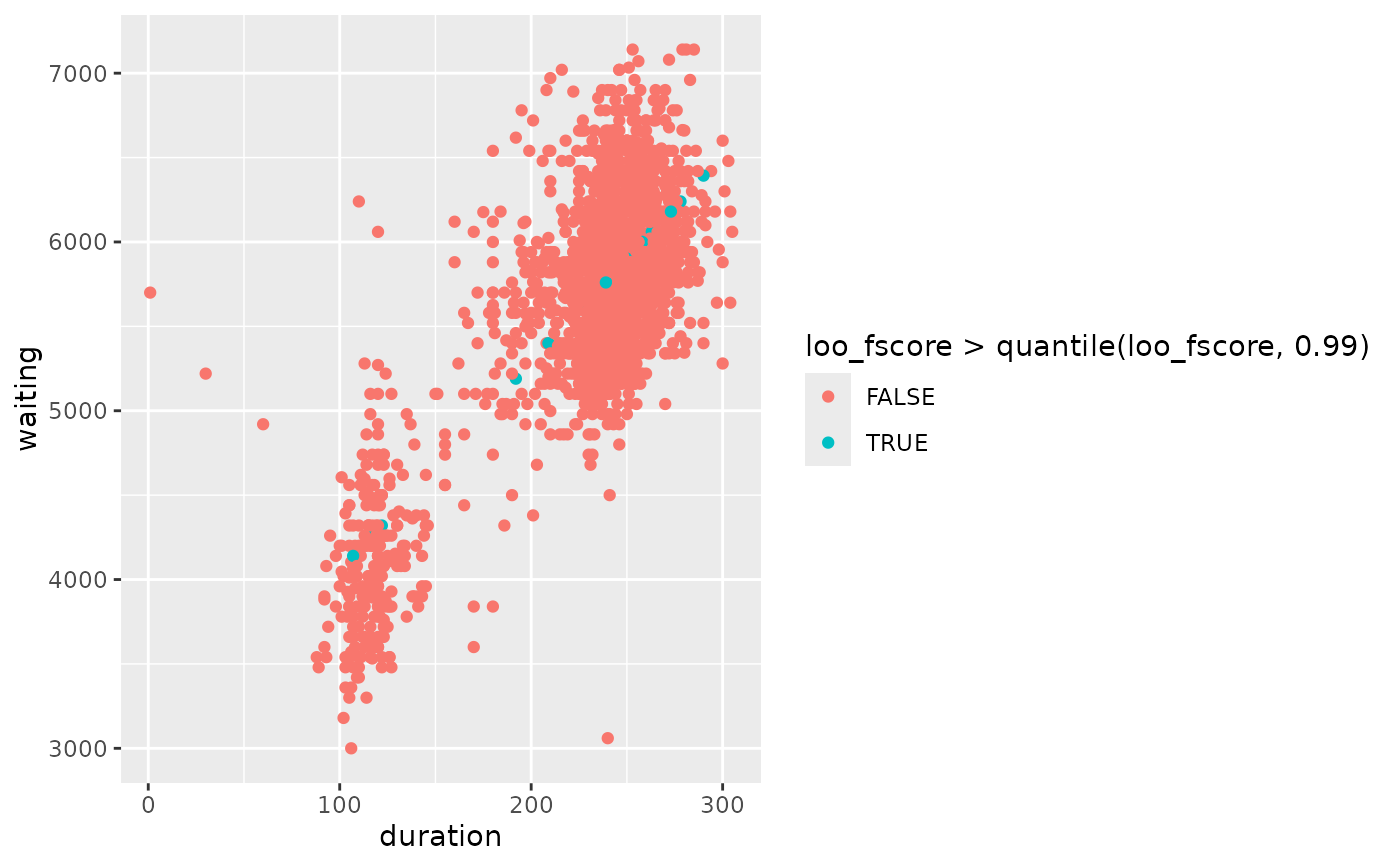
# A linear model (i.e., a conditional Gaussian distribution)
lm_of <- lm(waiting ~ duration, data = oldfaithful)
oldfaithful |>
  mutate(
    fscore = surprisals_prob(lm_of),
    prob = surprisals_prob(lm_of, loo = TRUE),
  ) |>
  ggplot(aes(
    x = duration, y = waiting,
    color = prob < 0.01
  )) +
  geom_point()

# A Poisson GLM
glm_breaks <- glm(breaks ~ wool + tension, data = warpbreaks, family = poisson)
warpbreaks |>
  mutate(prob = surprisals_prob(glm_breaks)) |>
  filter(prob < 0.05)
#>   breaks wool tension       prob
#> 1     70    A       L 0.04923568
# A Poisson GLM
glm_breaks <- glm(breaks ~ wool + tension, data = warpbreaks, family = poisson)
warpbreaks |>
mutate(prob = surprisals_prob(glm_breaks)) |>
filter(prob < 0.05)
#> breaks wool tension prob
#> 1 70 A L 0.04923568