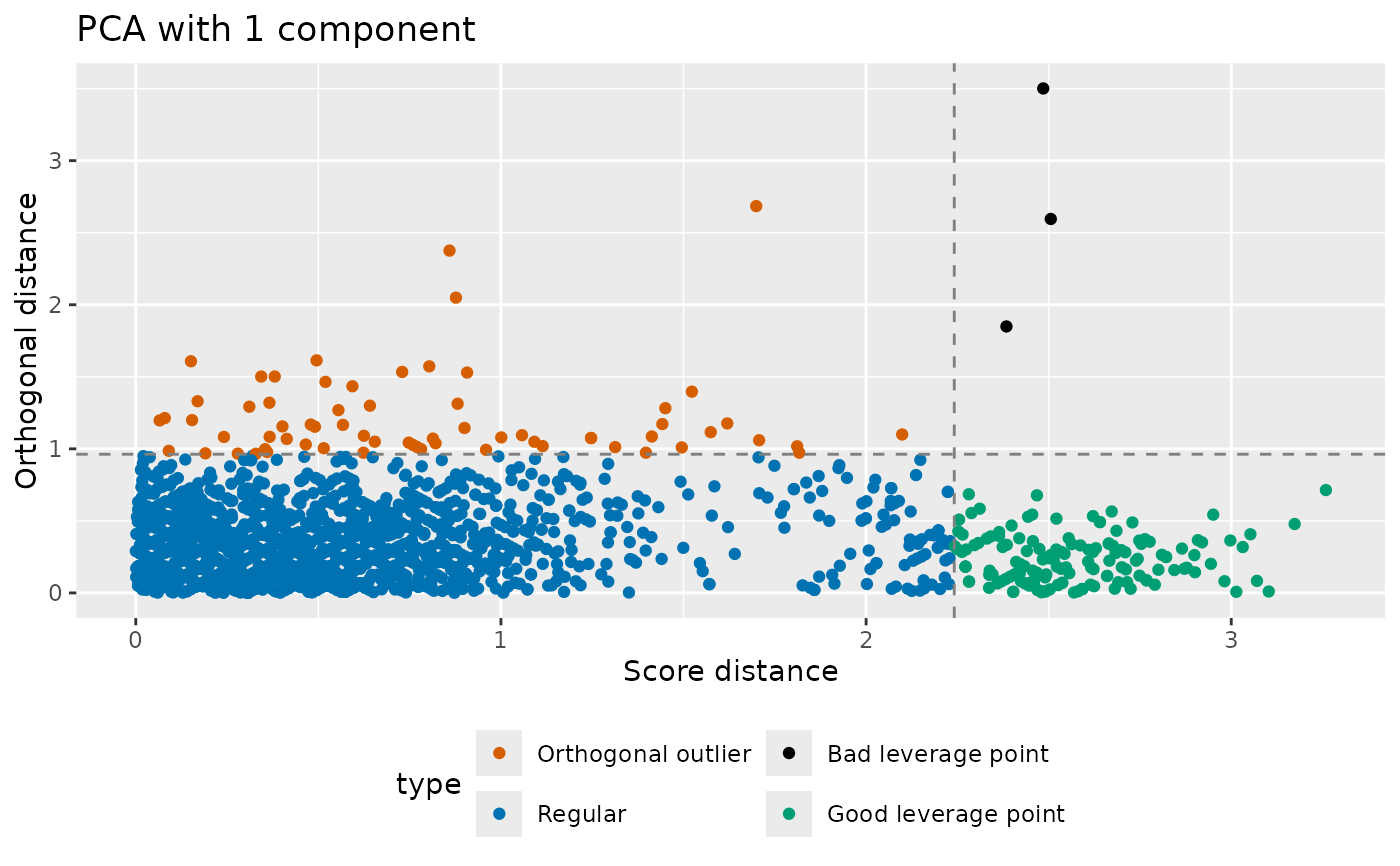
Outlier map from a projection or principal component analysis
Source:R/outlier_map.R
outlier_map.RdDraw an outlier map showing the score distance and orthogonal
distance of each observation from a projection or principal component
analysis. The score distance measures how far an observation lies from the
centre within the projection subspace, while the orthogonal distance
measures how far it lies from the subspace. Pass object (the output of
stats::prcomp() or an rrcov Pca* function); otherwise supply scores and
loadings together with the original data. For a prcomp object, use its
rank. argument to set the number of retained components.
When object is a PCA-like object and show_thresholds = TRUE, the
score-distance and orthogonal-distance cutoffs are drawn as dashed lines and
observations are coloured by type:
- Regular observation
small score and orthogonal distance.
- Good leverage point
large score distance, small orthogonal distance.
- Orthogonal outlier
small score distance, large orthogonal distance.
- Bad leverage point
large score and orthogonal distance.
The cutoffs are only defined for PCA-like objects, so show_thresholds is
ignored when scores and loadings are passed directly.
Usage
outlier_map(
  object = NULL,
  data = NULL,
  scores = NULL,
  loadings = NULL,
  show_thresholds = TRUE,
  ...
)
Arguments
- object
Optionally, the output of
stats::prcomp()or an rrcovPca*function. For aprcompobject, set the number of retained components with itsrank.argument. If supplied, thescoresandloadingsarguments are ignored.- data
The original data matrix or data frame used to compute the projection, scaled if the projection was computed on scaled data. This is required to compute the orthogonal distances, except when
objectis a rrcovPca*object (which stores them).- scores
A matrix or data frame of scores, with one column per retained component. Ignored if
objectis supplied.- loadings
A matrix or data frame of loadings, with one column per retained component. Ignored if
objectis supplied.- show_thresholds
If
TRUE(the default) andobjectis a PCA-like object, the score-distance and orthogonal-distance cutoffs are drawn as dashed lines and observations are coloured by type. Ignored whenscoresandloadingsare passed directly.- ...
Additional arguments passed to
ggplot2::geom_point().
References
Hyndman, R J (2026) "That's weird: Anomaly detection using R", Chapter 9, https://OTexts.com/weird/.