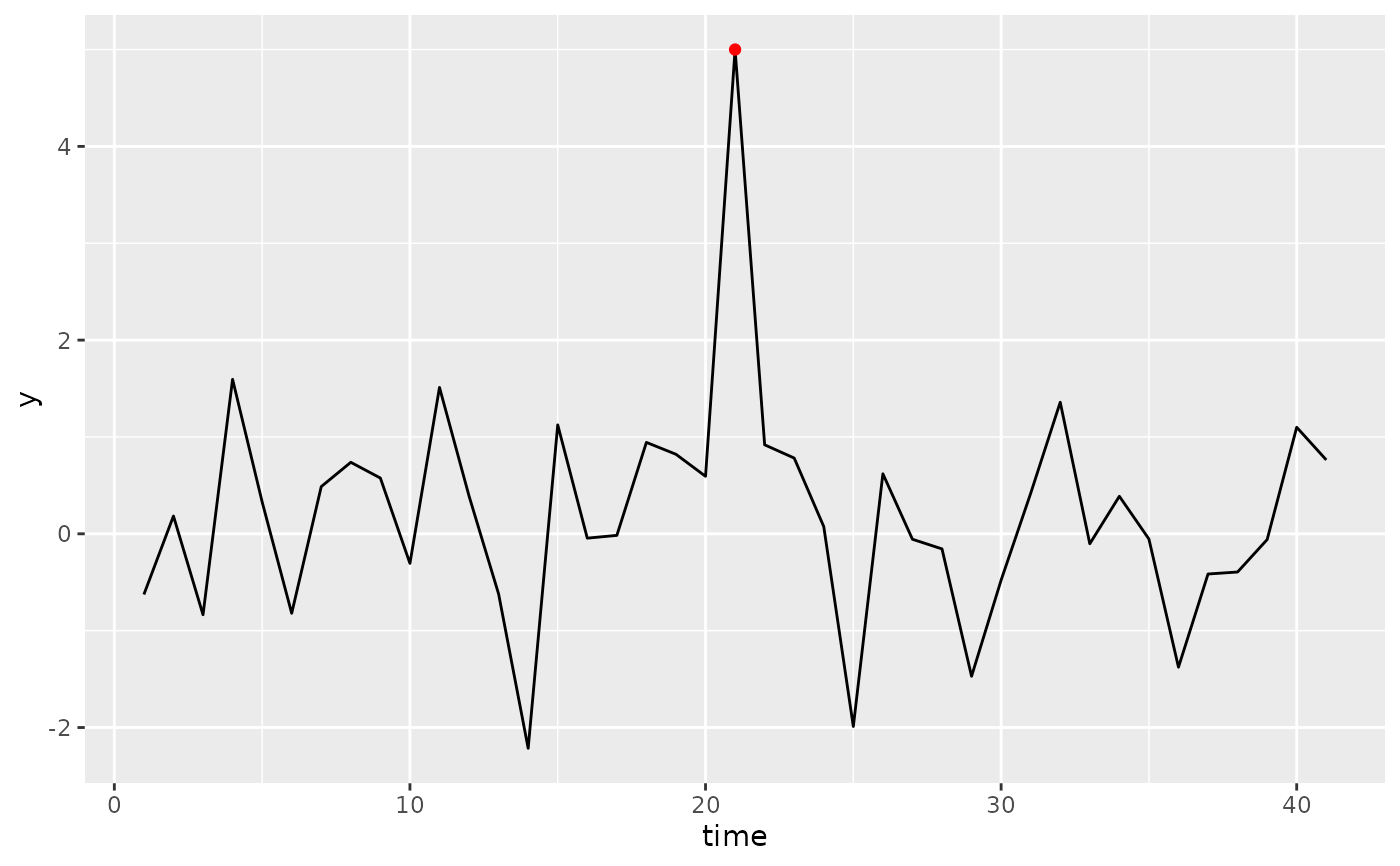
The Hampel filter is designed to find anomalies in time series data using mean absolute deviations in the vicinity of each observation.
Usage
hampel_anomalies(
  y,
  bandwidth,
  k = 3,
  alpha = NULL,
  approximation = c("none", "gpd", "empirical")
)
Arguments
- y
numeric vector containing time series
- bandwidth
integer specifying half-width of the window around each observation. That is, each window contains observations from t-bandwidth, ..., t+bandwidth. Must be at least 1.
- k
numeric number of standard deviations to declare an anomaly. Ignored if
alphais specified.- alpha
numeric significance level for declaring an anomaly under a normal distribution. If specified,
kis ignored and the threshold is determined by the significance level.- approximation
character string specifying the method to use for approximating the tail of the distribution of surprisal values. Options are "none" (no approximation), "gpd" (generalized Pareto distribution), or "empirical" (empirical distribution).
Details
First, a moving median is calculated using windows of size
2 * bandwidth + 1. Then the median absolute deviations from
this moving median are calculated in the same moving windows.
A point is declared an anomaly if its MAD value is more than k standard
deviations. The MAD is converted to a standard deviation using MAD * 1.4826,
which holds for normally distributed data.
The first bandwidth and last bandwidth observations cannot
be declared anomalies.
References
Hyndman, R J (2026) "That's weird: Anomaly detection using R", Section 10.2, https://OTexts.com/weird/.