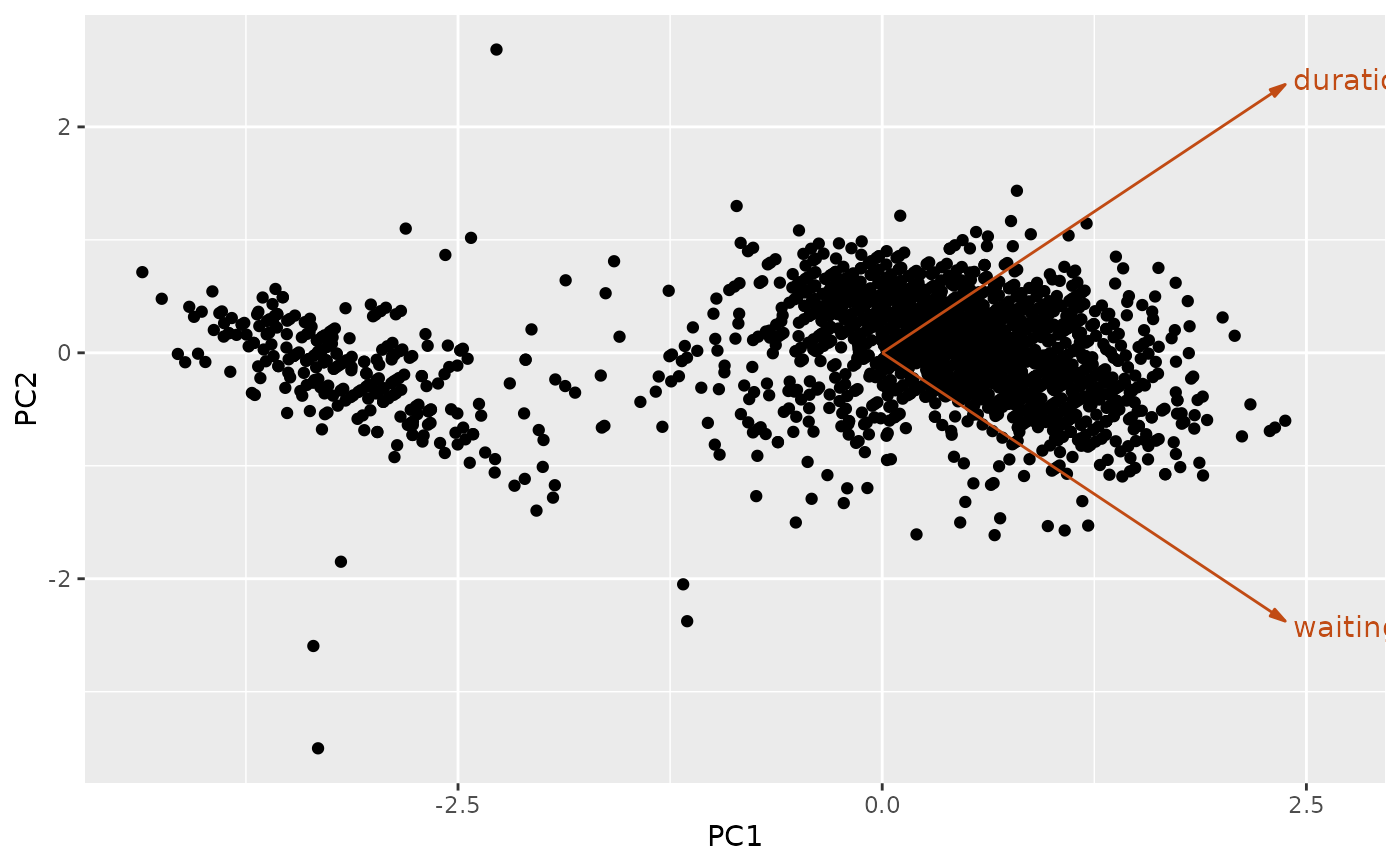
Draw a two-dimensional projection of the scores with the
original variable axes overlaid as arrows (loadings), as in a biplot. Pass
object (the output of stats::prcomp() or an rrcov::Pca* function);
otherwise supply scores and loadings directly. All scores should be
centred about the origin. The arrows are stretched by a common factor so that
the longest arrow just reaches the edge of the point cloud, and only loadings
longer than label_threshold are labelled.
Usage
biplot_projection(
  object = NULL,
  scores = NULL,
  loadings = NULL,
  label_threshold = 0,
  arrow_colour = "#c14b14",
  ...
)
Arguments
- object
Optionally, the output of
stats::prcomp()or anrrcov::Pca*function. If supplied, the scores and loadings are extracted from it and thescoresandloadingsarguments are ignored.- scores
A matrix or data frame of scores centred about the origin, with the first two columns used as the horizontal and vertical coordinates. Ignored if
objectis supplied.- loadings
A matrix or data frame of loadings, with row names giving the variable names and the first two columns used as the arrow directions. Ignored if
objectis supplied.- label_threshold
Only loadings whose absolute length exceeds this threshold are labelled. The default of
0labels every non-zero loading.- arrow_colour
Colour of the arrows and labels.
- ...
Additional arguments passed to
ggplot2::geom_point().
References
Hyndman, R J (2026) "That's weird: Anomaly detection using R", Chapter 9, https://OTexts.com/weird/.