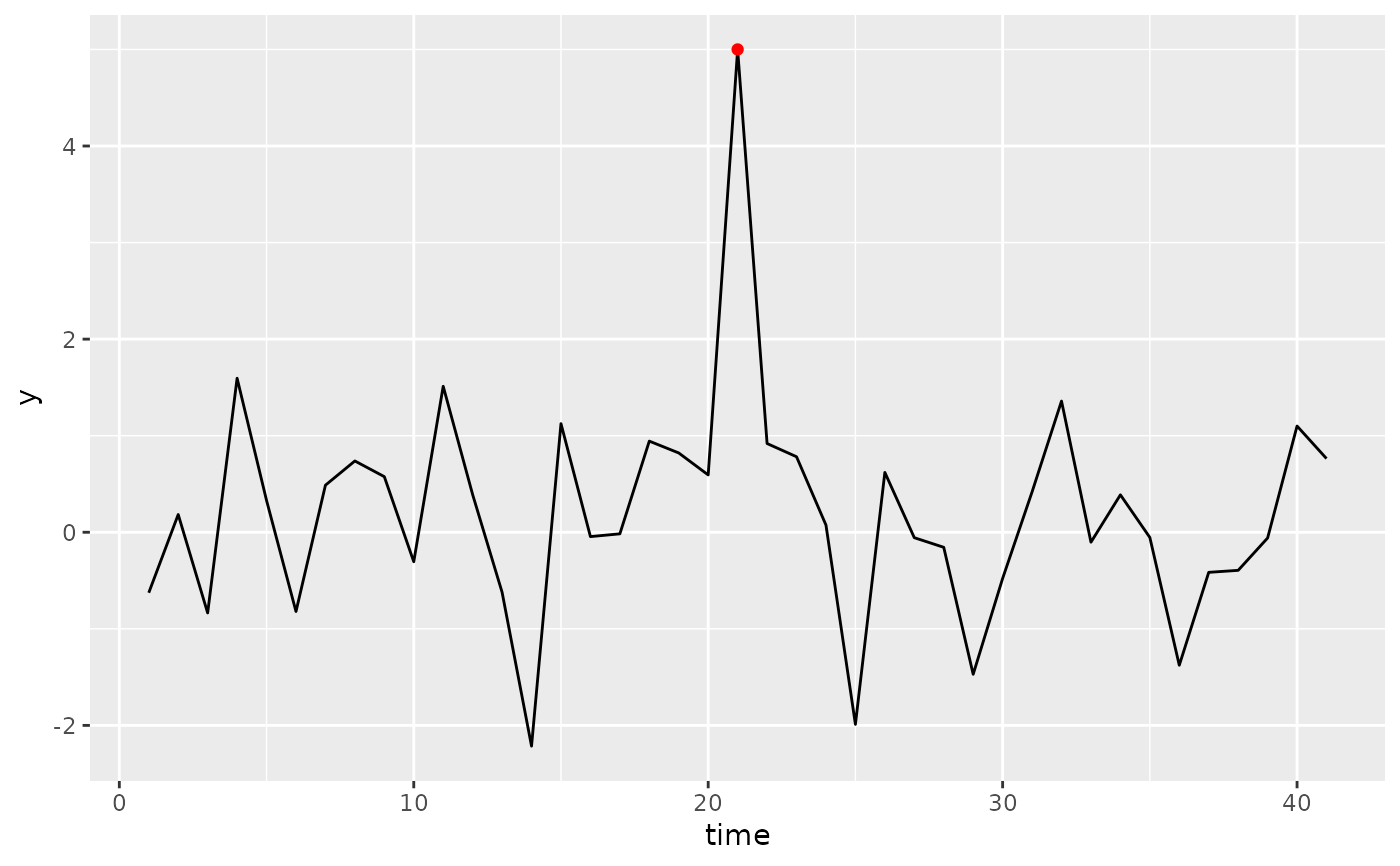
The Hampel filter is designed to find anomalies in time series data using mean absolute deviations in the vicinity of each observation.
Details
First, a moving median is calculated using windows of size
2 * bandwidth + 1. Then the median absolute deviations from
this moving median are calculated in the same moving windows.
A point is declared an anomaly if its MAD is value is more than k standard
deviations. The MAD is converted to a standard deviation using MAD * 1.482602,
which holds for normally distributed data.
The first bandwidth and last bandwidth observations cannot
be declared anomalies.
