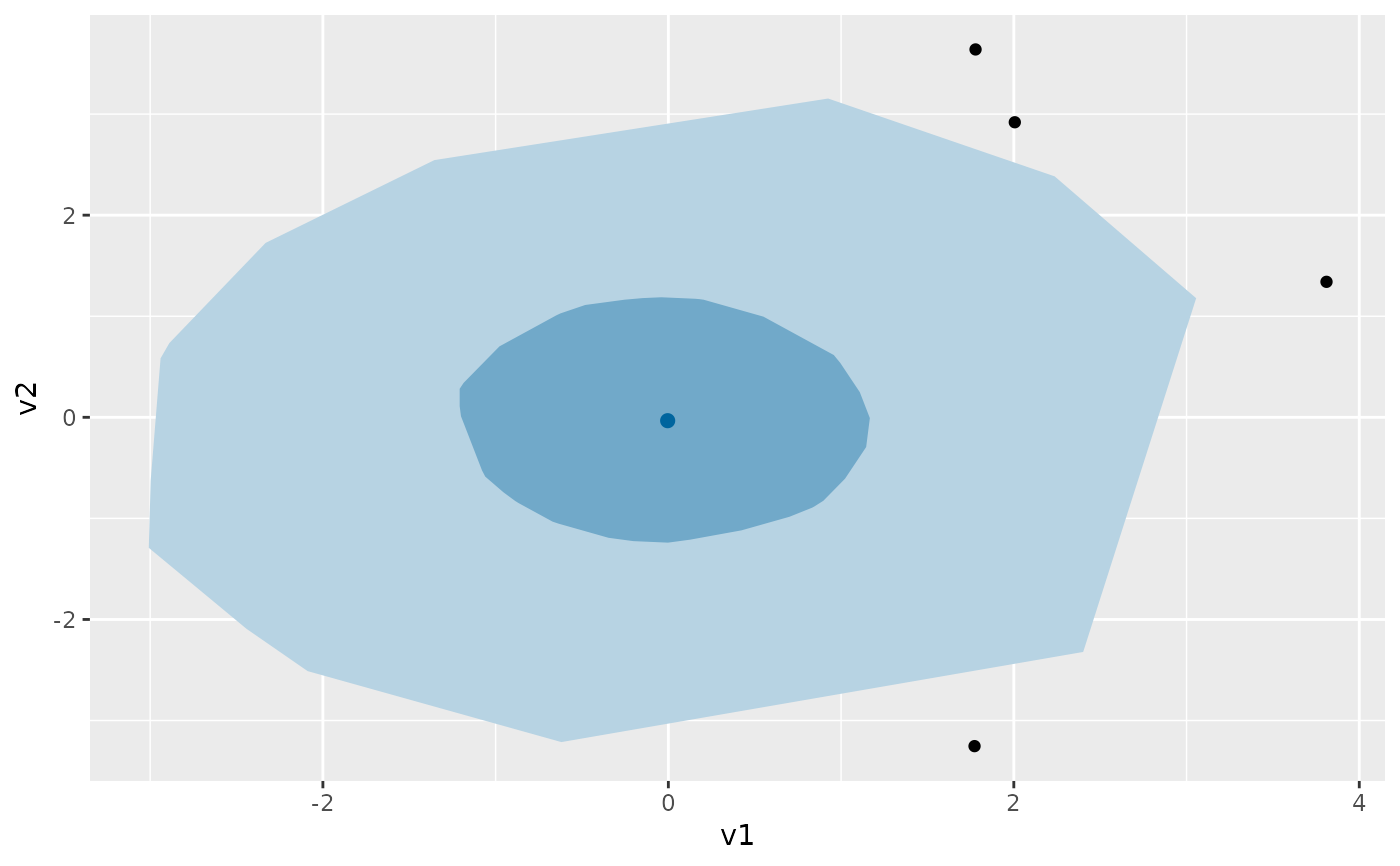
Produces a bivariate bagplot. A bagplot is analagous to a univariate boxplot, except it is in two dimensions. Like a boxplot, it shows the median, a region containing 50% of the observations, a region showing the remaining observations other than outliers, and any outliers.
Arguments
- data
A data frame or matrix containing the data.
- var1
The name of the first variable to plot (a bare expression).
- var2
The name of the second variable to plot (a bare expression).
- color
The base color to use for the median. Other colors are generated as a mixture of
colorwith white.- scatterplot
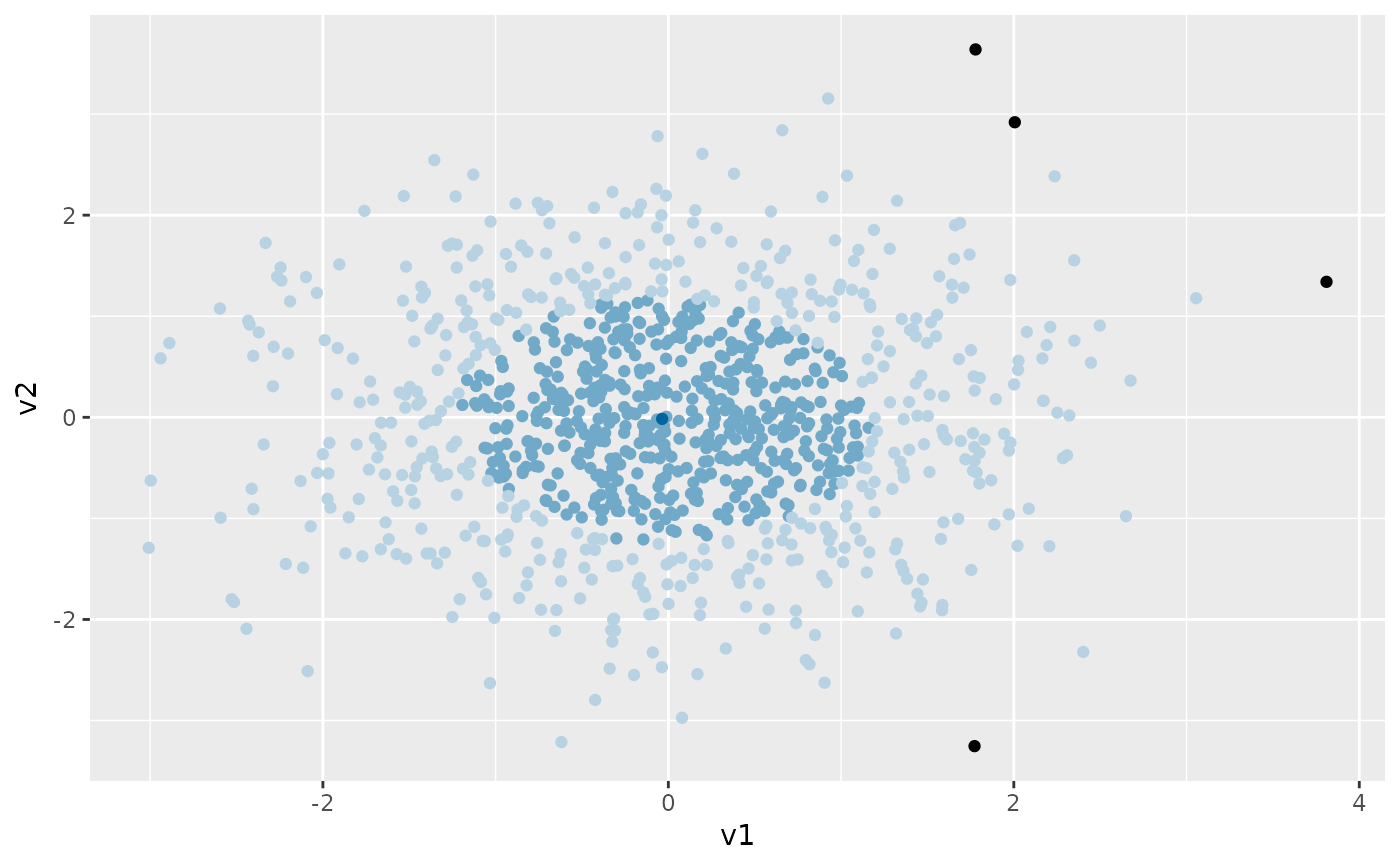
A logical argument indicating if a regular bagplot is required (
FALSE), or if a scatterplot in the same colors is required (TRUE).- ...
Other arguments are passed to the
compute.bagplotfunction.
References
Rousseeuw, P. J., Ruts, I., & Tukey, J. W. (1999). The bagplot: A bivariate boxplot. The American Statistician, 52(4), 382–387.