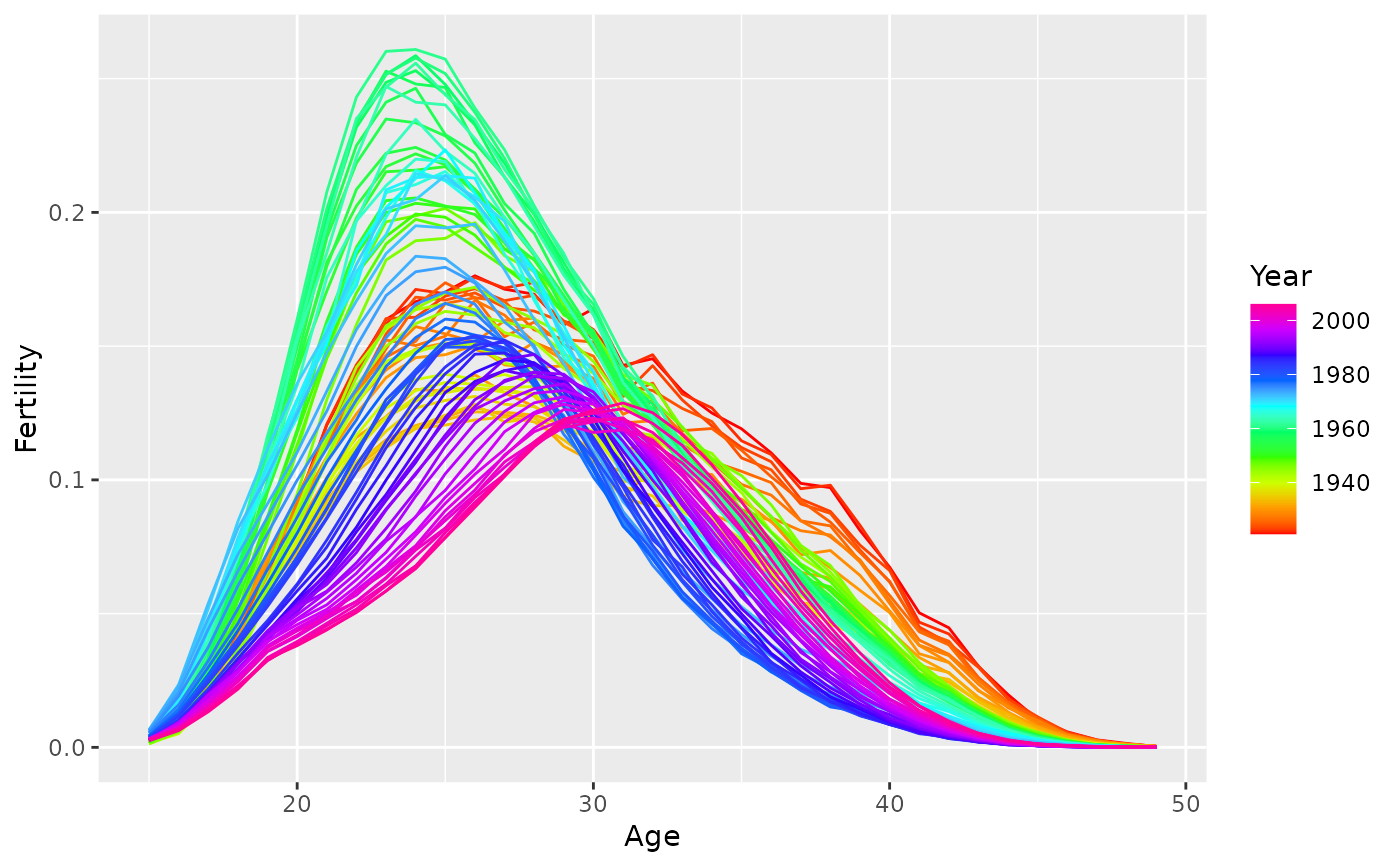
Produce rainbow plot (coloured by time index) of demographic variable against against age.
Arguments
- .data
A vital, tsibble or fable object including an age variable and the variable you wish to plot.
- .vars
A bare expression containing the name of the variable you wish to plot.
- age
Variable in `.data` containing start year of age intervals. If omitted, and `.data` is not a vital object, the variable with name `Age` or `Age_group` will be used (not case sensitive).
