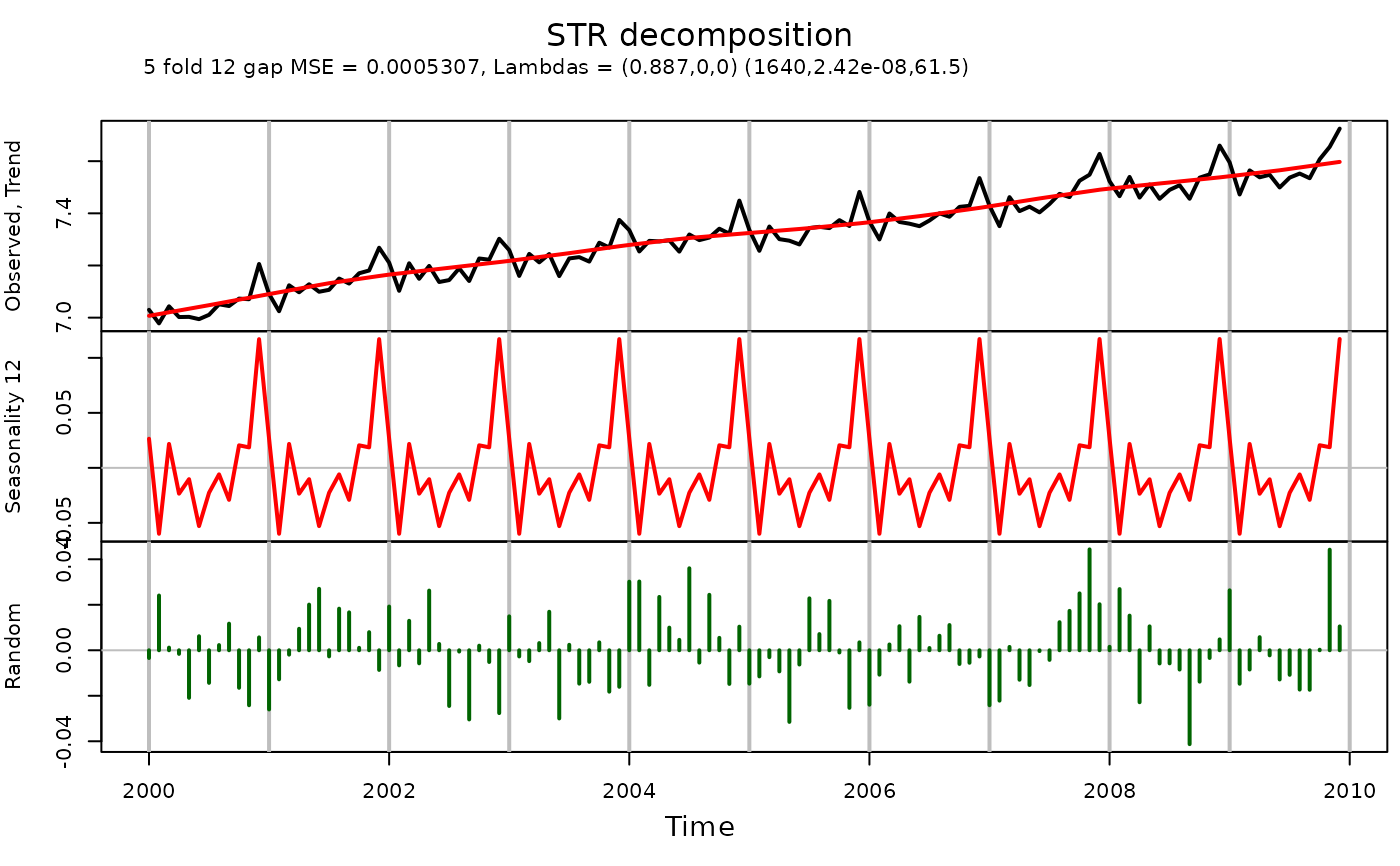
plot.STR plots results of STR decomposition.
Usage
# S3 method for class 'STR'
plot(
  x,
  xTime = NULL,
  dataPanels = 1,
  predictorPanels = as.list(seq_along(x$output$predictors)),
  randomPanels = length(x$output$predictors) + 1,
  forecastPanels = length(x$output$predictors) + 2,
  dataColor = "black",
  predictorColors = rep("red", length(x$output$predictors)),
  randomColor = "red",
  forecastColor = "blue",
  vLines = NULL,
  xlab = "Time",
  main = ifelse(x$method %in% c("STR", "STRmodel"), "STR decomposition",
    "Robust STR decomposition"),
  showLegend = TRUE,
  ...
)
Arguments
- x
Result of STR decomposition.
- xTime
Times for data to plot.
- dataPanels
Vector of panel numbers in which to plot the original data. Set to
NULLto not show data.- predictorPanels
A list of vectors of numbers where every such vector describes which panels should be used for plotting the corresponding predictor.
- randomPanels
Vector of panel numbers in which to plot the residuals. Set to
NULLto not show residuals.- forecastPanels
Vector of panel numbers in which to plot the fit/forecast. Set to
NULLto not show forecasts.- dataColor
Color to plot data.
- predictorColors
Vector of colors to plot components corresponding to the predictors.
- randomColor
Color to plot the residuals.
- forecastColor
Color to plot the fit/forecast.
- vLines
Vector of times where vertical lines will be plotted.
- xlab
Label for horizontal axis.
- main
Main heading for plot.
- showLegend
When
TRUE(default) legend is shown at top of plot.- ...
Other parameters to be passed directly to plot and lines functions in the implementation.
