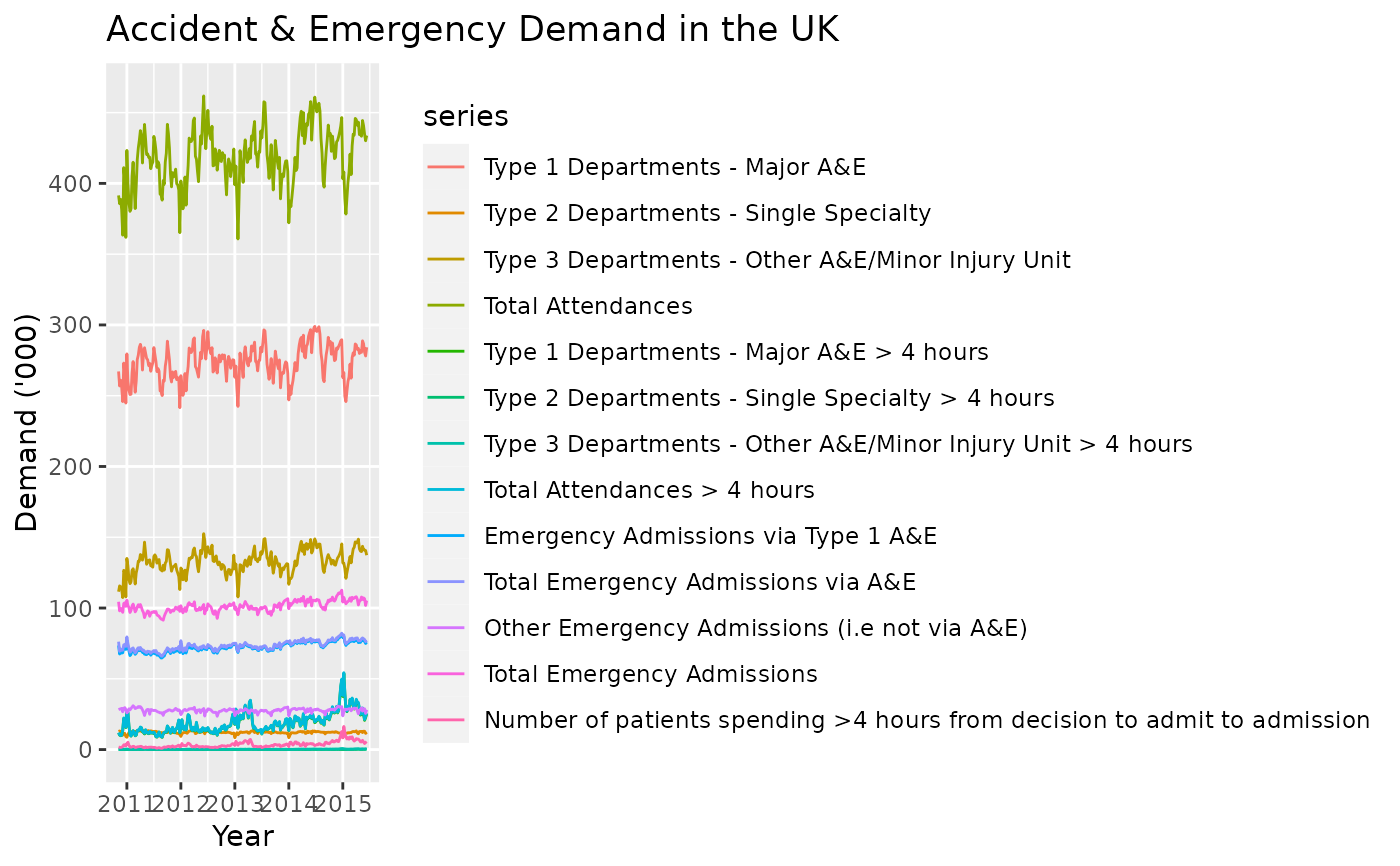
Weekly demand of Accident & Emergency departments in the UK, from 7 November 2010 to 7 June 2015.
Examples
library(ggplot2)
autoplot(AEdemand, xlab="Year", ylab="Demand ('000)") +
  ggtitle("Accident & Emergency Demand in the UK")


if (FALSE) {

# Demonstration of the adjustment of all temporal aggregates
# using Total Emergency Admissions

total <- AEdemand[,12]
totalagg <- tsaggregates(total)
plot(totalagg, main="Total Emergency Admissions")

# Base forecasts
base <- list()
for(i in 1:5)
  base[[i]] <- forecast(auto.arima(totalagg[[i]]))
base[[6]] <-  forecast(auto.arima(totalagg[[6]]), h=2)

# Reconciled forecasts
reconciled <- reconcilethief(base)

main <- paste(names(totalagg)," (k=",
           52/unlist(lapply(reconciled,frequency)),")",sep="")
par(mfrow=c(2,3))
for(i in 6:1)
{
  ylim <- range(base[[i]]$mean, base[[i]]$x, reconciled[[i]]$mean)
  plot(base[[i]], main=main[i], fcol='white',
      plot.conf=FALSE, ylim=ylim, xlim=c(2010.5,2017.5))
  polygon(c(2015.45, 2020, 2020, 2015.45),
          c(0, 0, 1e5, 1e5), col='grey', border=FALSE)
  lines(base[[i]]$mean, col='red', lty=2)
  lines(reconciled[[i]]$mean, col='blue')
}
}
if (FALSE) {
# Demonstration of the adjustment of all temporal aggregates
# using Total Emergency Admissions
total <- AEdemand[,12]
totalagg <- tsaggregates(total)
plot(totalagg, main="Total Emergency Admissions")
# Base forecasts
base <- list()
for(i in 1:5)
base[[i]] <- forecast(auto.arima(totalagg[[i]]))
base[[6]] <- forecast(auto.arima(totalagg[[6]]), h=2)
# Reconciled forecasts
reconciled <- reconcilethief(base)
main <- paste(names(totalagg)," (k=",
52/unlist(lapply(reconciled,frequency)),")",sep="")
par(mfrow=c(2,3))
for(i in 6:1)
{
ylim <- range(base[[i]]$mean, base[[i]]$x, reconciled[[i]]$mean)
plot(base[[i]], main=main[i], fcol='white',
plot.conf=FALSE, ylim=ylim, xlim=c(2010.5,2017.5))
polygon(c(2015.45, 2020, 2020, 2015.45),
c(0, 0, 1e5, 1e5), col='grey', border=FALSE)
lines(base[[i]]$mean, col='red', lty=2)
lines(reconciled[[i]]$mean, col='blue')
}
}