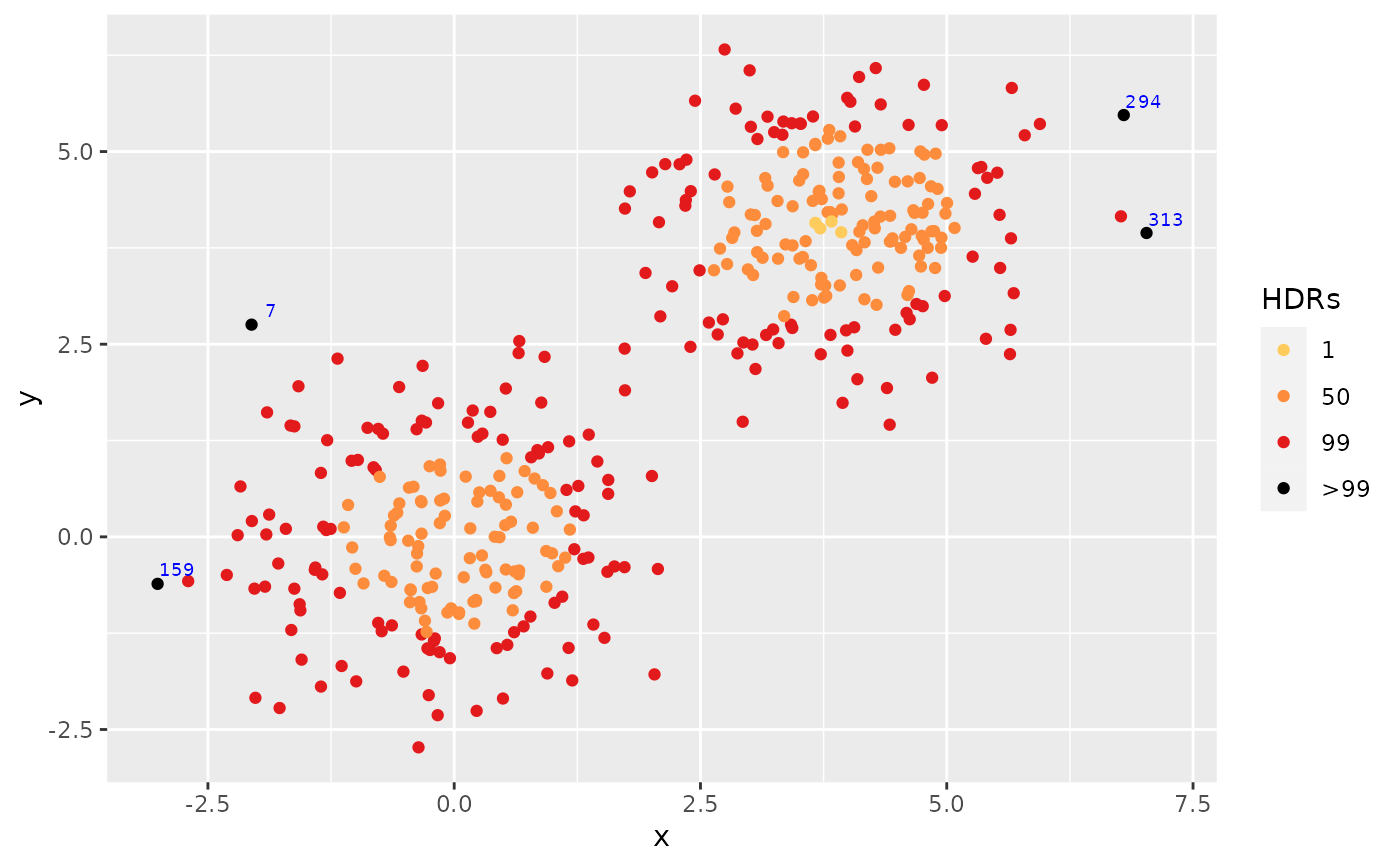
Produces a scatterplot where the points are coloured according to the bivariate HDRs in which they fall.
Arguments
- x
Numeric vector or matrix with 2 columns.
- y
Numeric vector of same length as
x.- levels
Percentage coverage for HDRs
- kde.package
Package to be used in calculating the kernel density estimate when
den=NULL.- noutliers
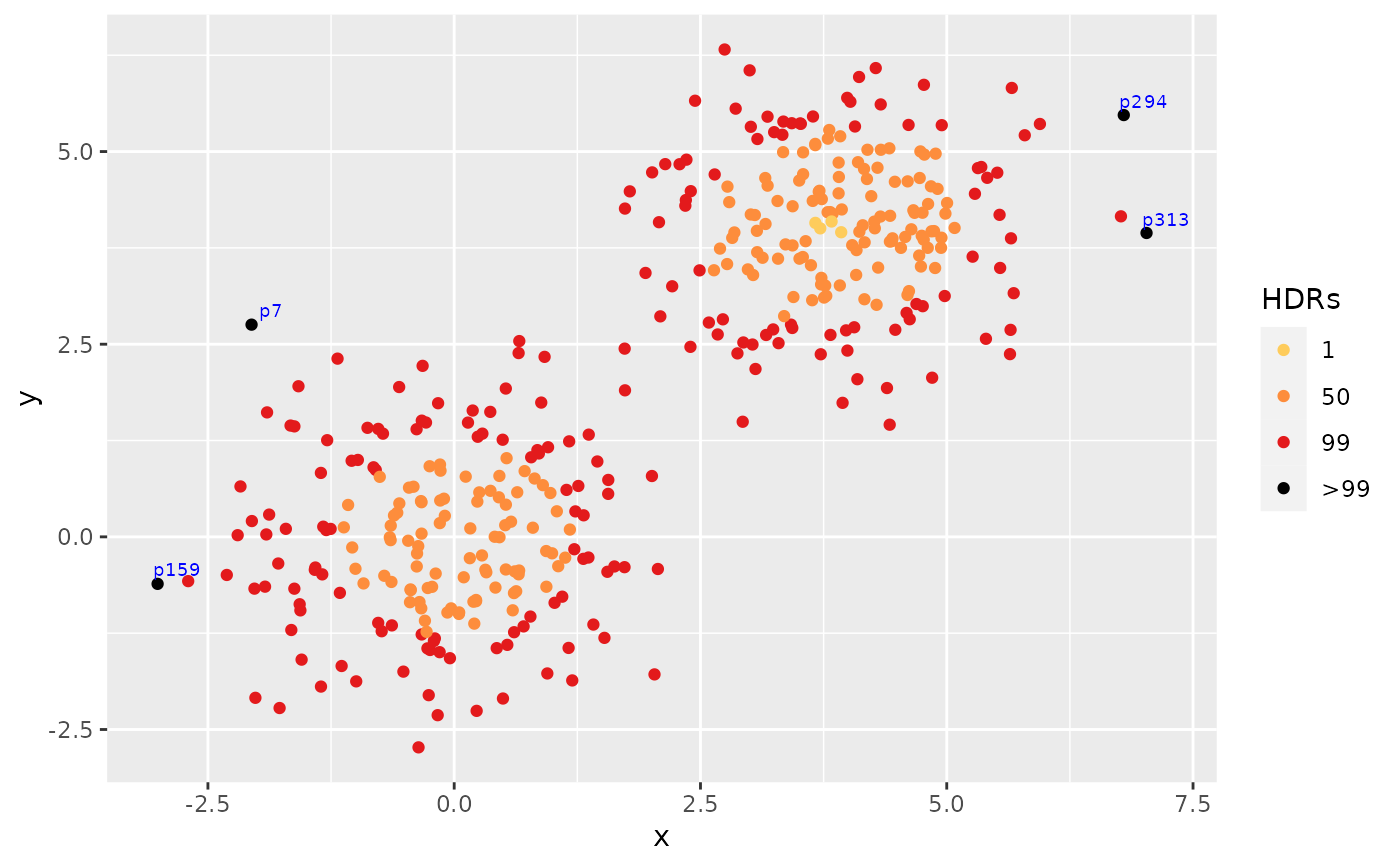
Number of outliers to be labelled. By default, all points outside the largest HDR are labelled.
- label
Label of outliers of same length as
xandy. By default, all outliers are labelled as the row index of the point(x, y).
Details
The bivariate density is estimated using kernel density estimation. Either
ash::ash2() or ks::kde() is used to do the
calculations. Then Hyndman's (1996) density quantile algorithm is used to
compute the HDRs. The scatterplot of (x,y) is created where the points are
coloured according to which HDR they fall. A ggplot object is returned.