R/data.R
insurance.Rd
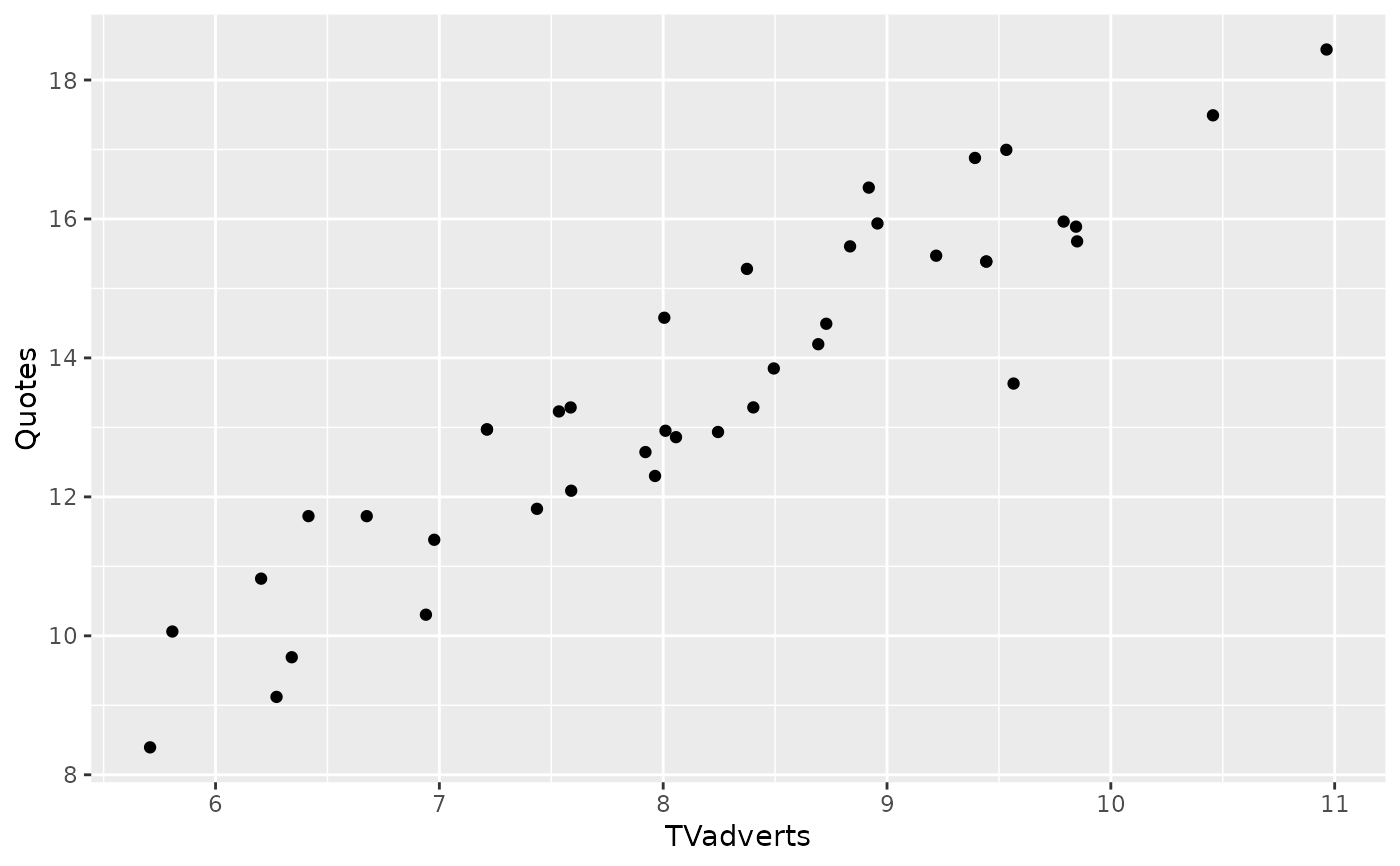
Monthly quotations and monthly television advertising expenditure for a US insurance company. January 2002 to April 2005
Monthly time series of class `tsibble`.
Kindly provided by Dave Reilly, Automatic Forecasting Systems.
insurance %>%
  ggplot(aes(x=TVadverts, y=Quotes)) + geom_point()