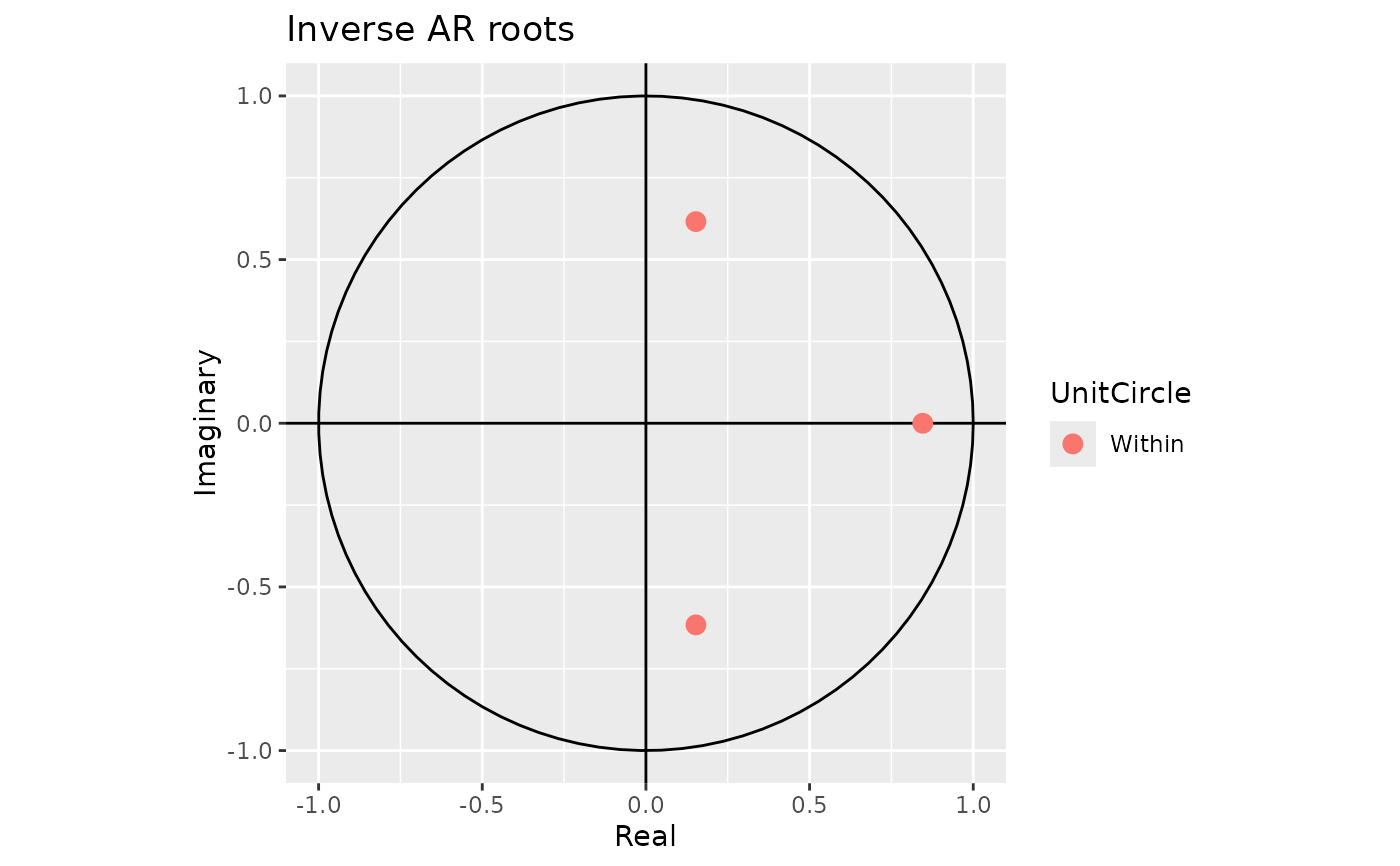
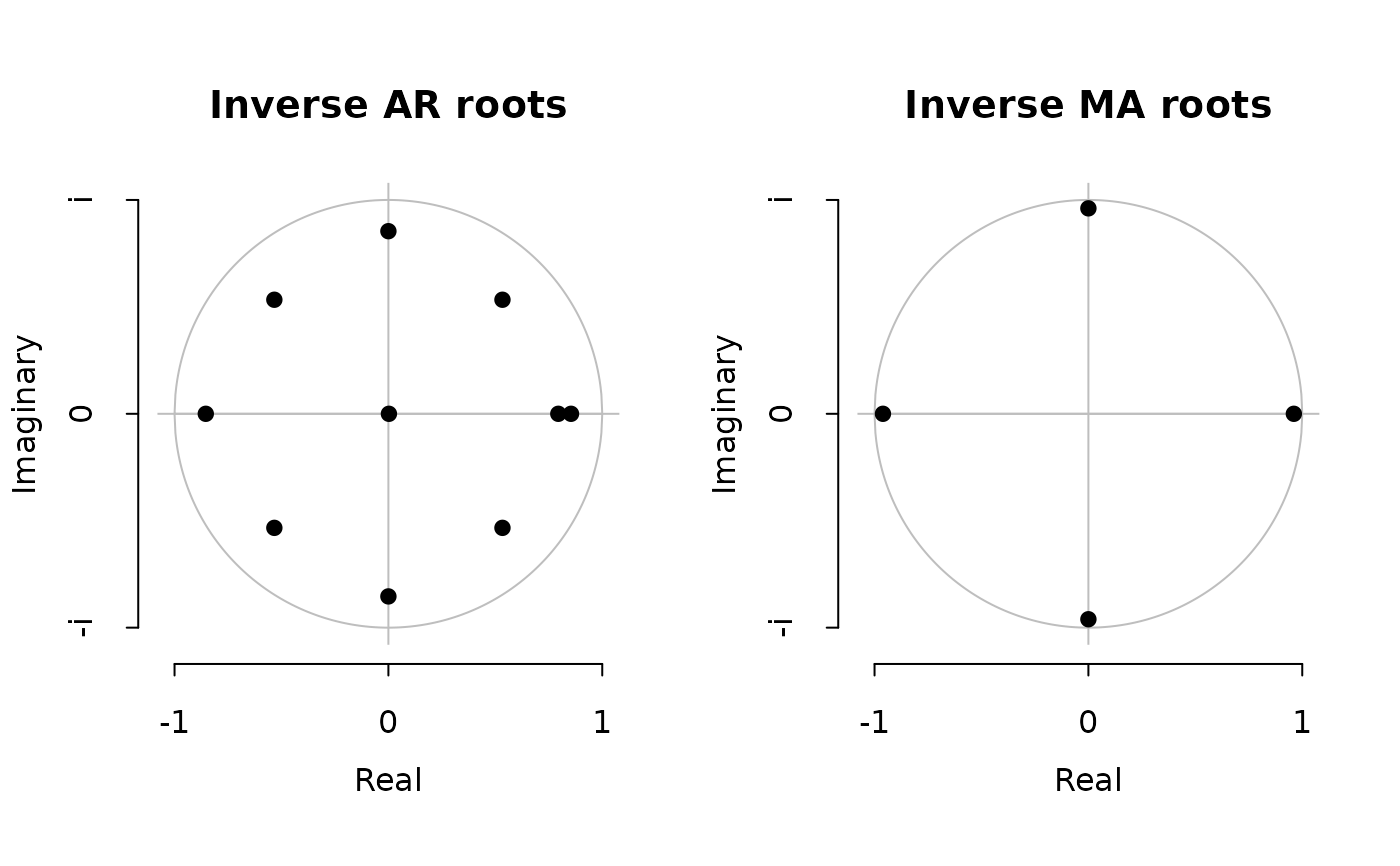
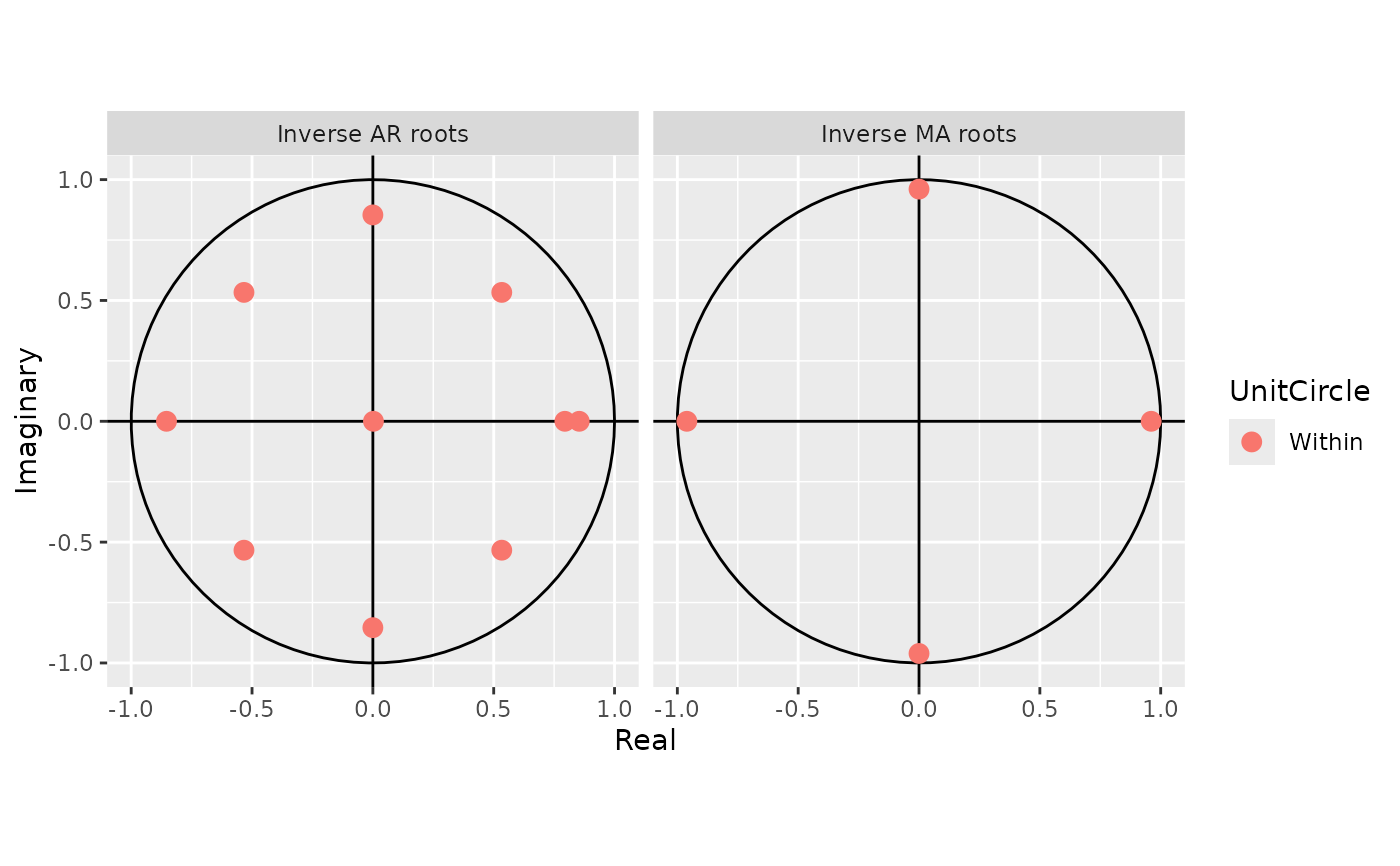
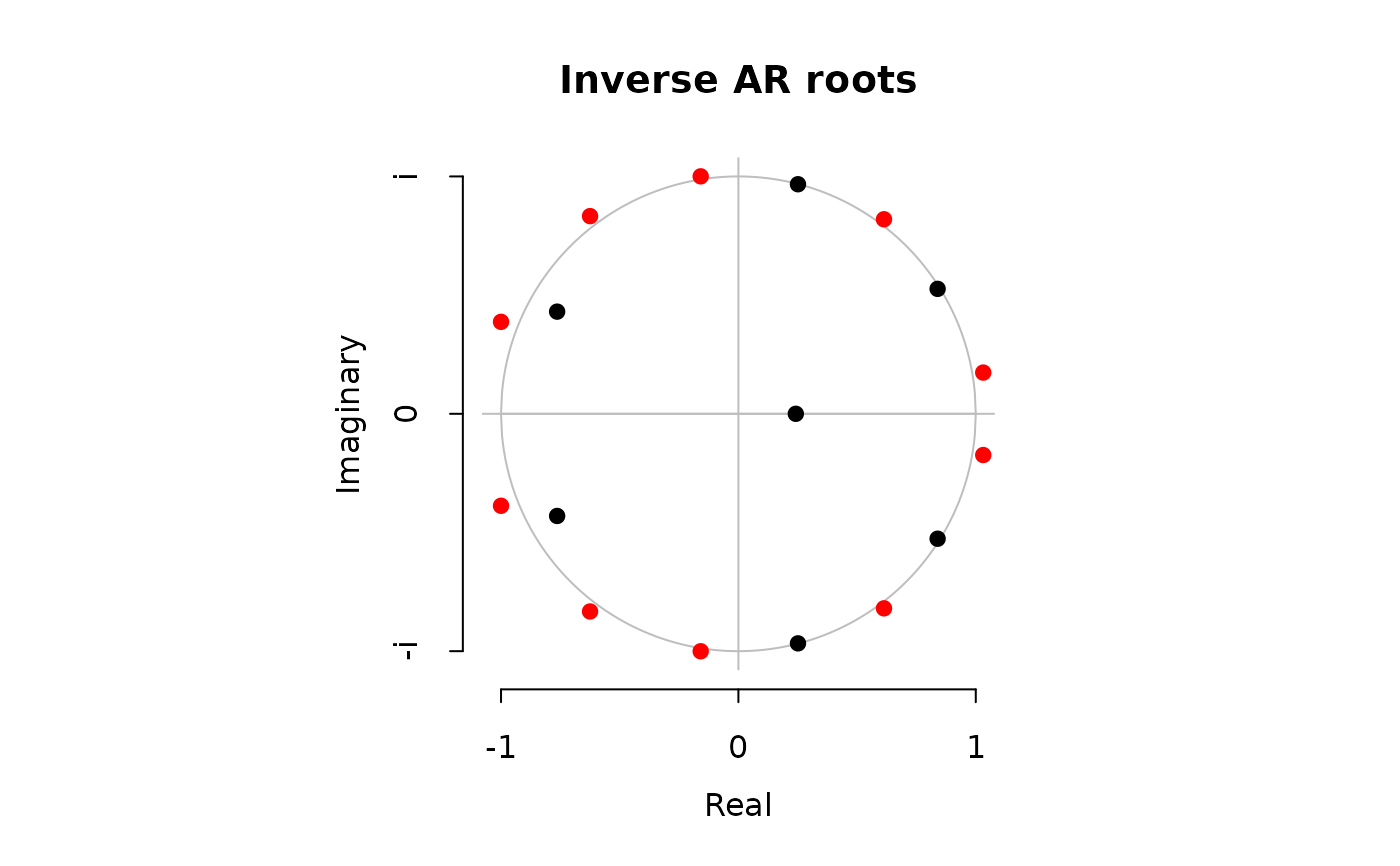
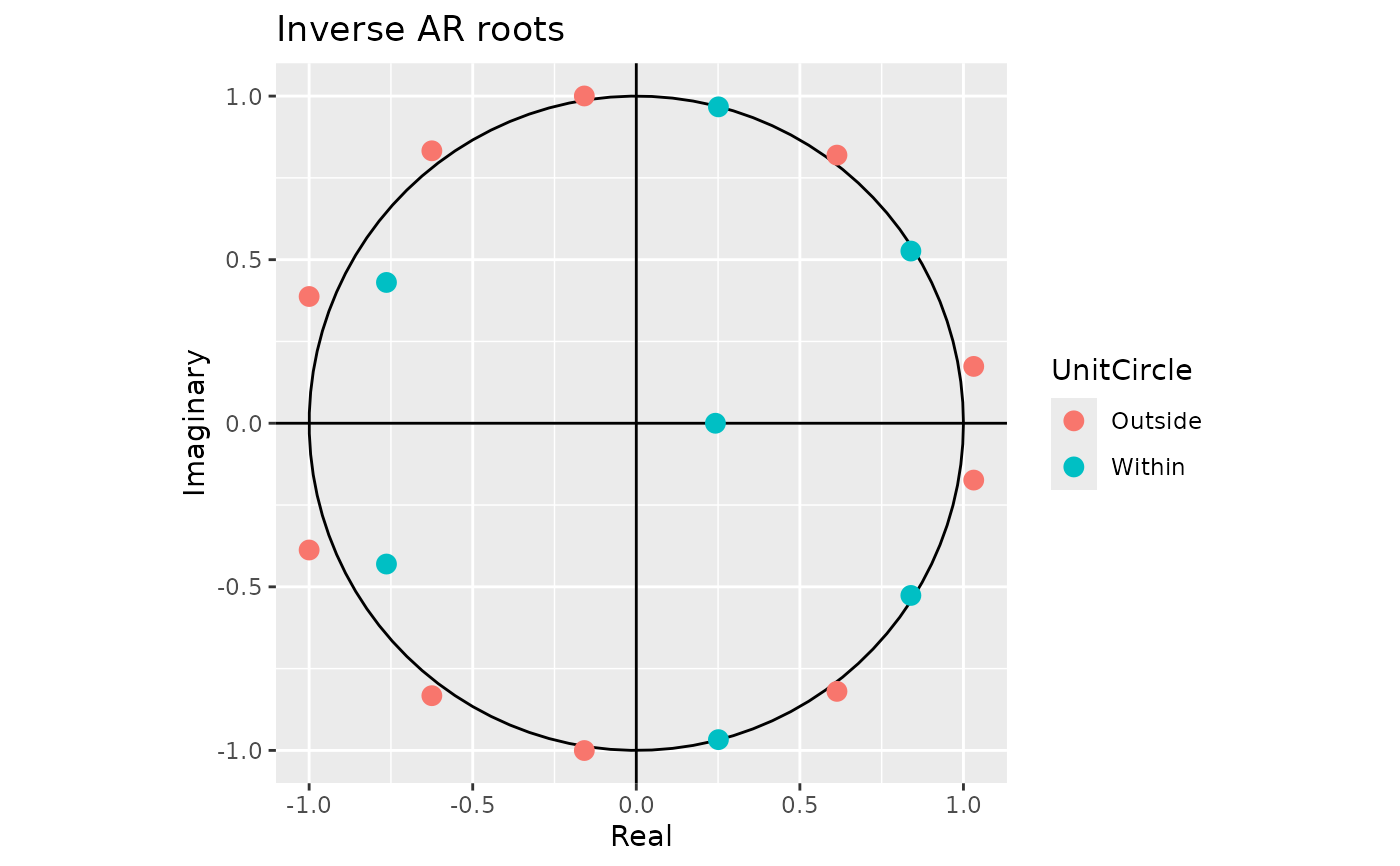
Produces a plot of the inverse AR and MA roots of an ARIMA model. Inverse roots outside the unit circle are shown in red.
Usage
# S3 method for class 'Arima'
plot(
  x,
  type = c("both", "ar", "ma"),
  main,
  xlab = "Real",
  ylab = "Imaginary",
  ...
)

# S3 method for class 'ar'
plot(x, main, xlab = "Real", ylab = "Imaginary", ...)

# S3 method for class 'Arima'
autoplot(object, type = c("both", "ar", "ma"), ...)

# S3 method for class 'ar'
autoplot(object, ...)
Arguments
- x
Object of class “Arima” or “ar”.
- type
Determines if both AR and MA roots are plotted, of if just one set is plotted.
- main
Main title. Default is "Inverse AR roots" or "Inverse MA roots".
- xlab
X-axis label.
- ylab
Y-axis label.
- ...
Other plotting parameters passed to
par.- object
Object of class “Arima” or “ar”. Used for ggplot graphics (S3 method consistency).