Plot time series decomposition components using ggplot
Source:R/ggplot.R, R/mstl.R
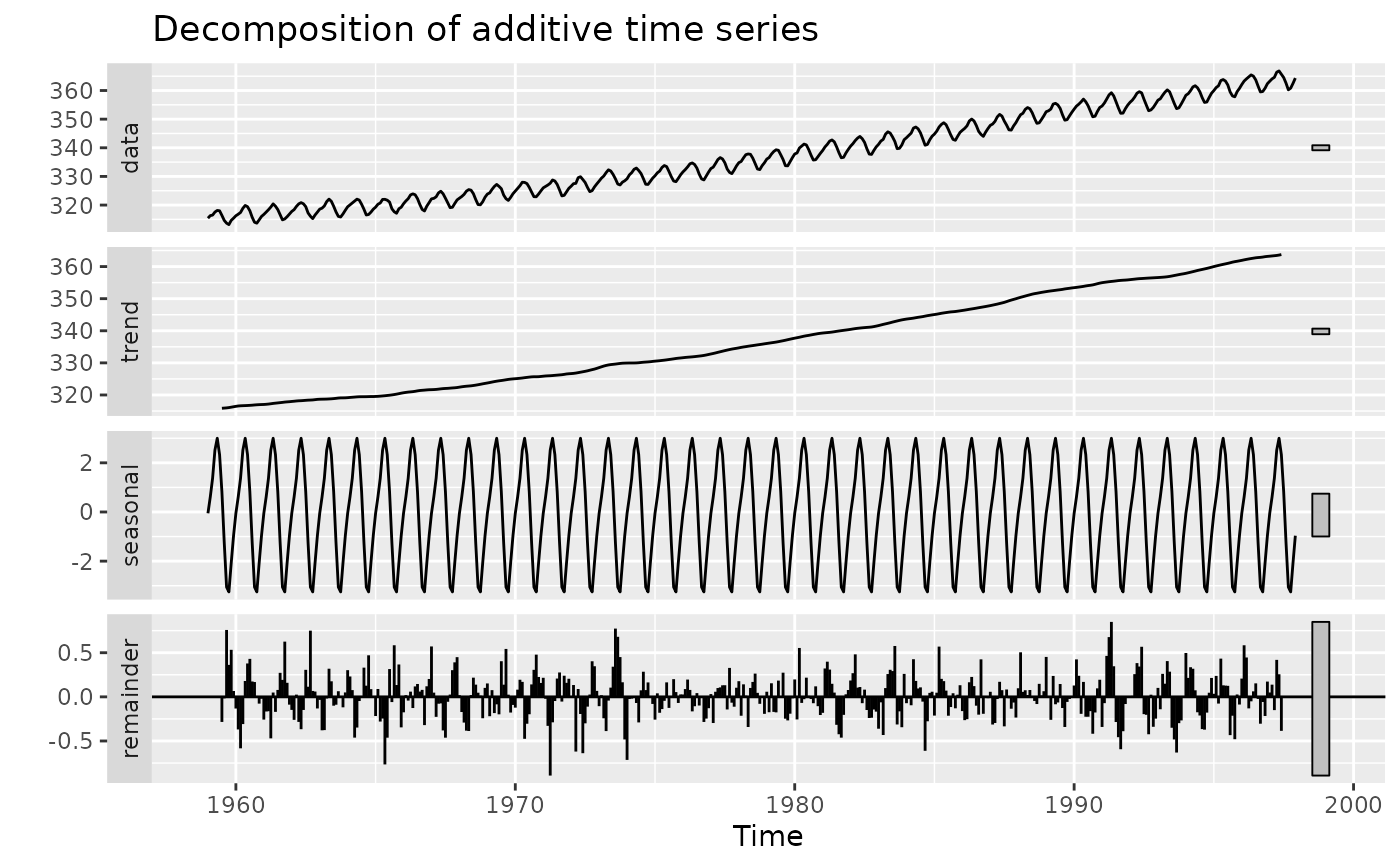
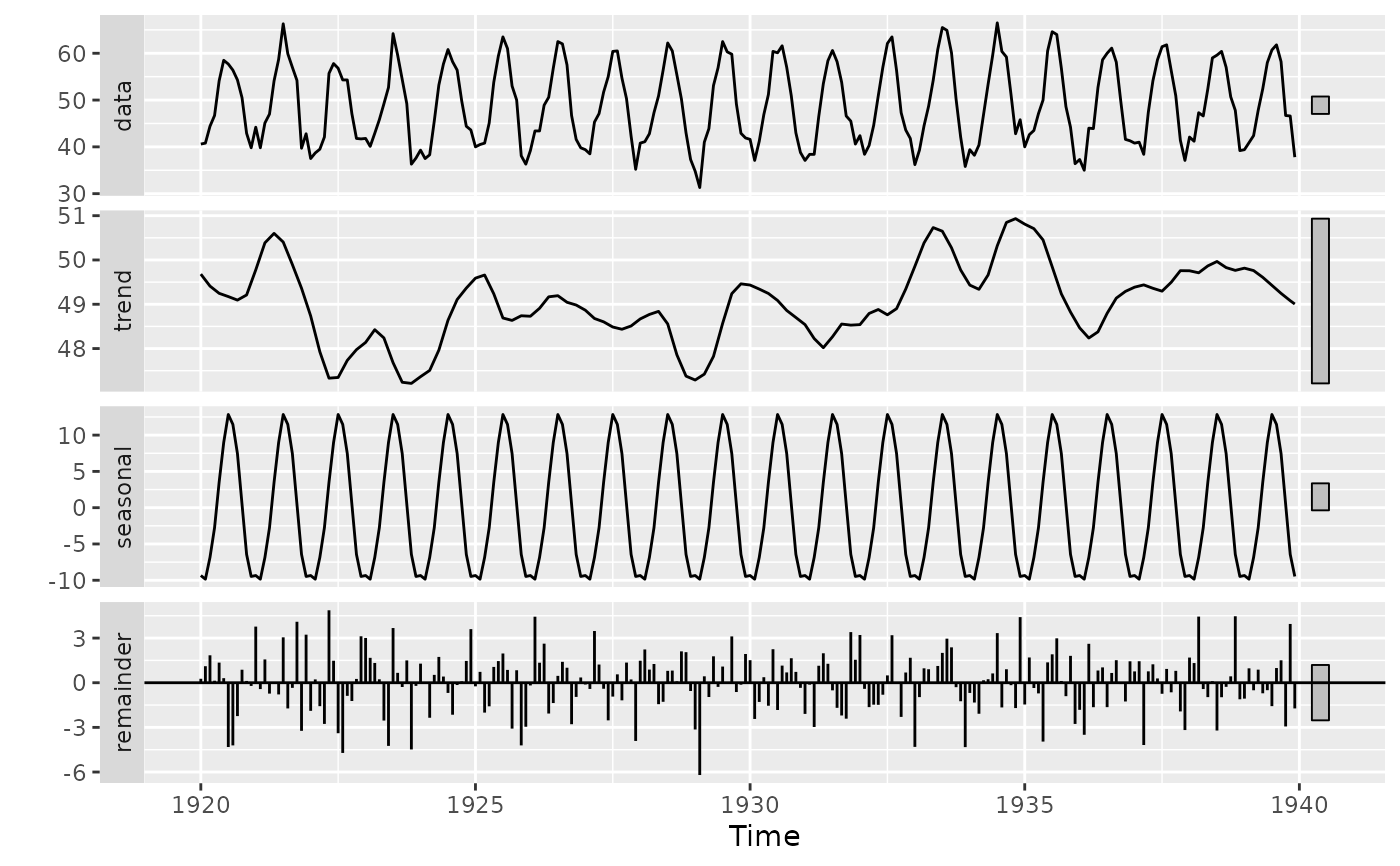
autoplot.seas.RdProduces a ggplot object of seasonally decomposed time series for objects of
class “stl” (created with stl), class
“seas” (created with seas), or class
“decomposed.ts” (created with decompose).
Usage
# S3 method for decomposed.ts
autoplot(object, labels = NULL, range.bars = NULL, ...)

# S3 method for stl
autoplot(object, labels = NULL, range.bars = TRUE, ...)

# S3 method for StructTS
autoplot(object, labels = NULL, range.bars = TRUE, ...)

# S3 method for seas
autoplot(object, labels = NULL, range.bars = NULL, ...)

# S3 method for mstl
autoplot(object, ...)
Arguments
- object
Object of class “
seas”, “stl”, or “decomposed.ts”.- labels
Labels to replace “seasonal”, “trend”, and “remainder”.
- range.bars
Logical indicating if each plot should have a bar at its right side representing relative size. If
NULL, automatic selection takes place.- ...
Other plotting parameters to affect the plot.