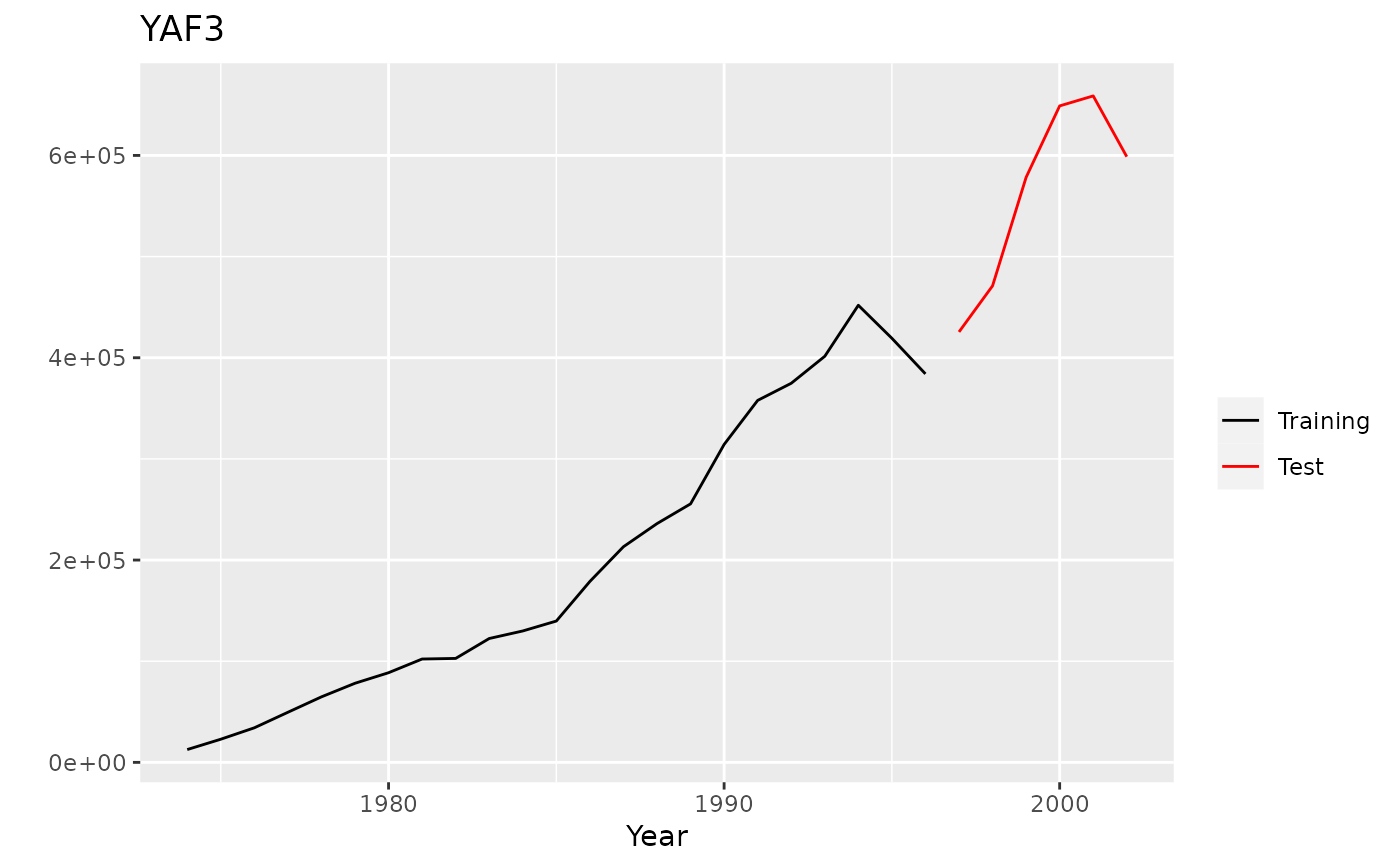
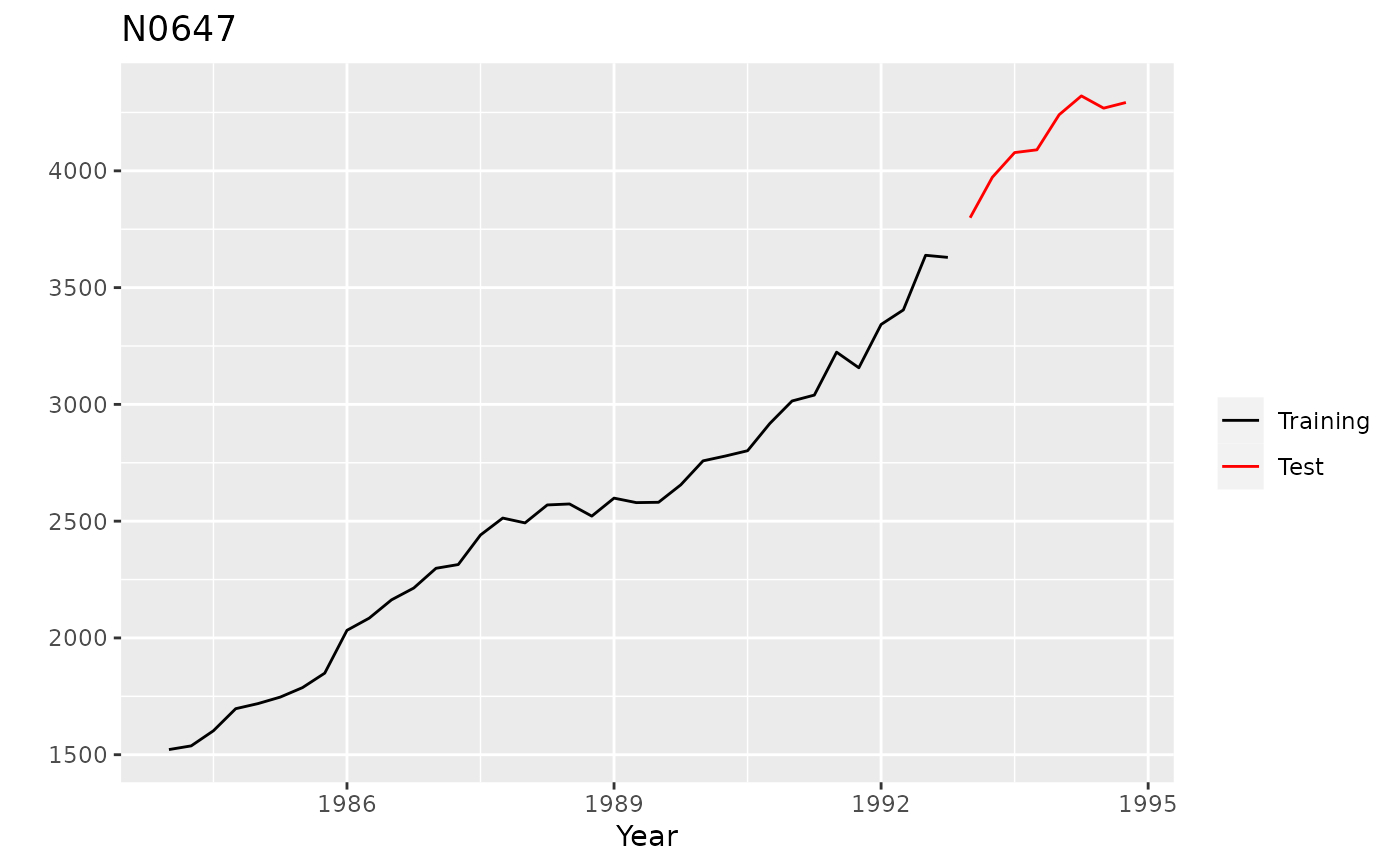
Functions to plot a time series from the M competition data sets, showing
both the training and test sections of the series.
Usage
# S3 method for class 'Mdata'
plot(
  x,
  xlim = c(tsp(x$x)[1], tsp(x$xx)[2]),
  ylim = range(x$x, x$xx),
  main = x$sn,
  xlab,
  ylab = "",
  ...
)

# S3 method for class 'Mdata'
autoplot(object, ...)
Arguments
- x, object
A series of M-competition data
- xlim
Limits on x-axis
- ylim
Limits on y-axis
- main
Main title
- xlab
Label on x-axis
- ylab
Label on y-axis
- ...
Other plotting arguments passed to plot. Ignored for
autoplot.
Value
autoplot.Mdata returns a ggplot2 object, while
plot.Mdata returns nothing. Both functions produce a time series plot
of the selected series.